![]()
![]()
![]()
![]()
![]()
![]()
![]()
Maptitude Insurance Mapping Software provides ways for you to use maps to analyze and understand how geography affects you and your business. Maptitude is an essential tool for all types of insurance applications including risk assessment, resource deployment, premium pricing, product marketing, and customer support and information systems.
Maptitude gives you the tools, maps, and latest Census demographic data you need, plus special functions to allow you to tie in the data you use every day in your work. With Maptitude you can visualize data in new and different ways, unearth geographic patterns in your data, and convey information in a straightforward way. Insurance brokers, adjusters, appraisers, and analysts will all benefit from the tools and data provided in Maptitude.
| Highlights of Using GIS in Insurance |
|---|
|

Map your portfolio and then determine its exposure to various risks.
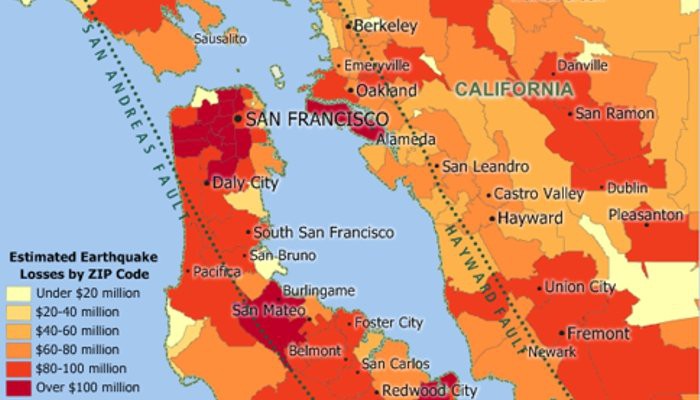
Map risk exposure and assess insurance risk with GIS insurance mapping software: Aggregate earthquake cost by ZIP Code.
Use the included nationwide streets to map locations
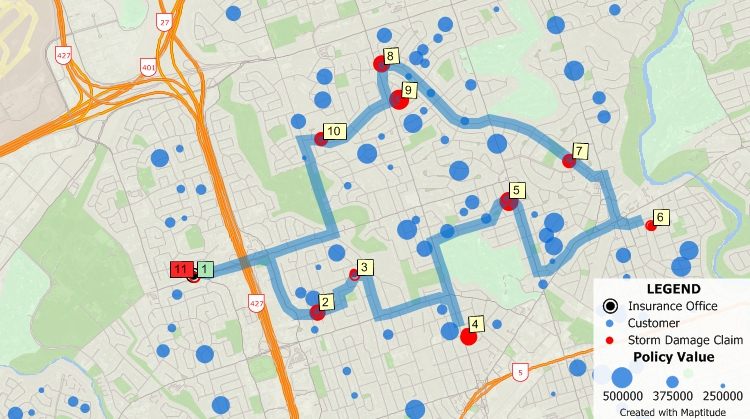
Find policy holders and display information about them on a map; even find a route for a claims adjuster to visit a set of them.
Map locations that are prone to various risks or that have particular demographic characteristics.
Maptitude lets you create maps using your own data. Maptitude has direct access for a number of database, geographic, and raster file formats. In addition, you can access your data via ODBC from a number of data sources such as Access, Oracle, and SQL Server. You can also join and aggregate your data to any of the nationwide geographic files included with Maptitude such as states, counties, or ZIP Codes, or to your own custom territories.
Other Maptitude functions can be harnesses for modeling, data collection, data analysis, and specialized insurance applications. For example, Maptitude includes a built-in interface for GPS devices. You can create accurate geographic files in the field with a GPS and a laptop, such as a database of fire hydrants for the most detailed fire hazard assessments, or precise measurements of fields for crop insurance underwriting. Surface analysis and 3-D mapping functions let you build contour maps that you can overlay with soil analysis data to determine mud slide risks.
In all cases, Maptitude is the cost-effective solution that gives you extensive demographic and geographic data plus sophisticated spatial analysis tools so that you can convey information and analyze risk for your business advantage.
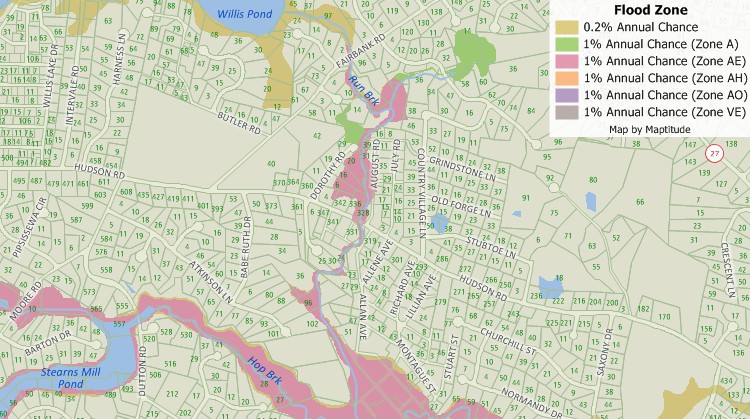
See which parcels are required to purchase mandatory flood insurance.
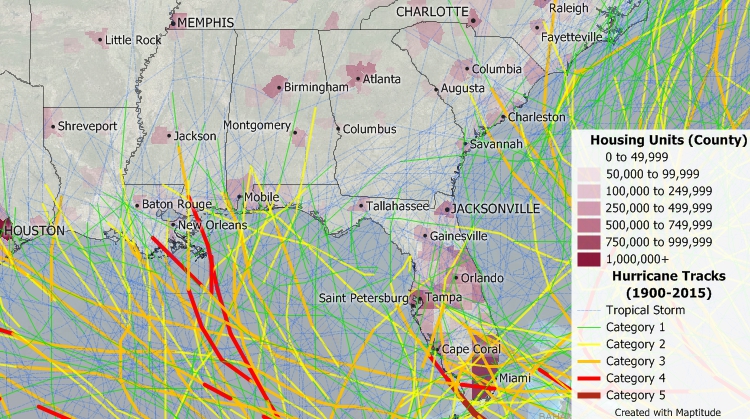
Analyze areas most at risk of hurricanes.
In addition to the latest demographic estimates, Maptitude includes substantial demographic and income data from the Census that you can use to identify locations with desirable characteristics for your insuance agency growth. Analysis tools even let you compare the demographics around several different sites to determine their market potential.
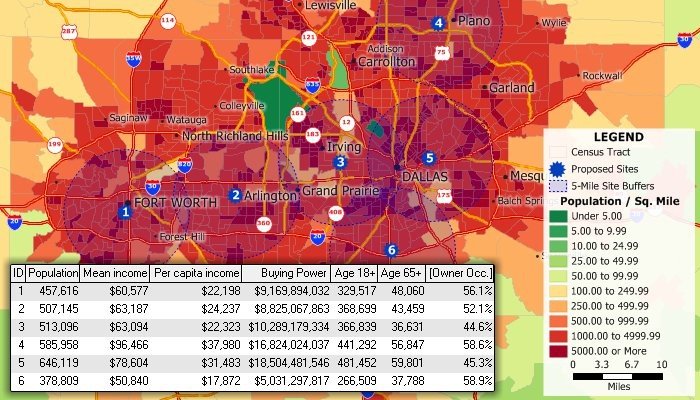
Site analysis can be performed with the included Census data. This map and table show the demographics of the population within five miles of several locations.
 Check out our G2 Reviews