|
March 2017 Newsletter |
|||
|
|||


Website | Contact Us | Pricing | Live Demo | Free Trial | Reviews
Upgrade to Maptitude 2017 for US$395: Last Chance!
For a short time, we are extending our US$395 reduced upgrade pricing for all Maptitude desktop licenses. This deal saves you US$300! Also, each US order will include a free US ZIP Code update: a US$250 value! The upgrade offer and the free data together save you a total of US$550!
If you don't know which version of Maptitude you have, or you have an older license of Maptitude, contact us to check on your eligibility for upgrade pricing!
Maptitude 2017 is a major new release. Stop using outdated information and get the most detailed and accurate data and demographics ever included.
Limited Offer: Valid until May 31, 2017. Restrictions Apply.
New Release: 4 Ways Maptitude 2017 Saves You Time & Money
Commercial realtors need to analyze client locations in relation to properties. Delivery companies need to be able to create vehicle routes that have different characteristics. Franchises, retail chains, and hospitals need to know where their customers are in relation to their locations. Maptitude 2017 makes it easier-than-ever to meet these requirements. Here are 4 key areas where Maptitude 2017 will prove critical for your organization:
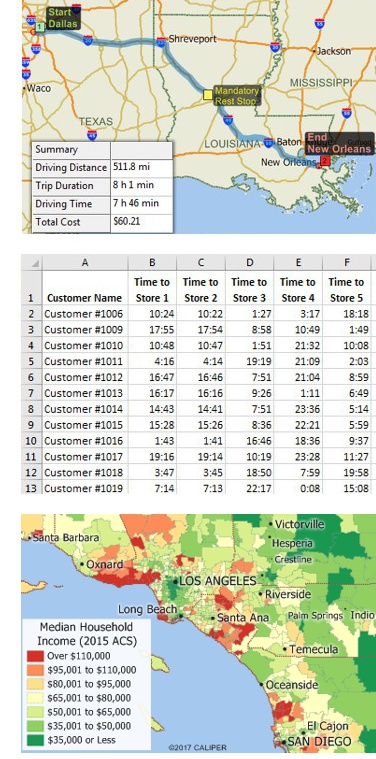
1. Routing: The Routing Manager can apply a default vehicle stop time or read stop times from an Excel table and lock the first and last stops. A list of route stops can be immediately exported to Excel along with the longitude and latitude of each stop.
Example: When you know your start and final destinations, such as a depot, and have calculated the time allotted for each stop, Maptitude will create a route that accurately reflects your requirements, optimized using the latest streets data.
» Learn how in this video tutorial
2. Logistics: The Distance and Travel Time Tables Tool creates an Excel table that lists the costs of travel between any number of origins and destinations. You can now quickly identify the closest and backup locations ranked by travel distance or time.
Example: You can calculate the closest sales representative to each client or the closest vendor for each store. When the closest location is not available for reasons such as low inventory or temporary outages, you can immediately determine the alternative closest suppliers.
3. Reports: The Radius Drawing Tool is used to draw a circle anywhere on a map. You then right click on the circle to export to an Excel report the travel time and distance from the location clicked on to all locations within the circle.
Example: If you have a hospital, store, or business facility you can quickly analyze the travel times for the patients/customers/employees that are located within your market area.
» Learn how in this video tutorial
4. Software and Data: Many MapPoint users have switched to Maptitude, but there is still widespread use of MapPoint. Using MapPoint is detrimental to your business operations and destroys the credibility of your reports because the data you are using was outdated even at the time of release. Maptitude 2017 ships with the most up-to-date geographic and demographic information available. Maptitude also includes all the key features and tools of MapPoint (more...).
There are many more improvements in Maptitude 2017! Please contact the Maptitude Sales Team with any questions. View our new Maptitude 2017 videos here.
| What benefits have you realized with Maptitude? | |
 |
Ease of moving territories, obtaining census data and plotting territories to that data. Beautiful interface and several ways to customize the product and exports. The ability to pull in my older MapPoint files and data was a huge plus! Great video tutorials that help you as well. Aaron Wesson
Marketing Operations Manager |
| What business problems are you solving? | |
 |
I highly recommend this piece of software to all sales managers out there who are struggling to keep track of their sales data and find trends in it. By using Maptitude, I was able to keep track of everything. Presenting these data to my boss can also be a daunting task, but Maptitude just makes my life easier . Jayson Gumanid Entrepreneur |
Featured Map:
Healthcare Providers Per 100,000 Population by State
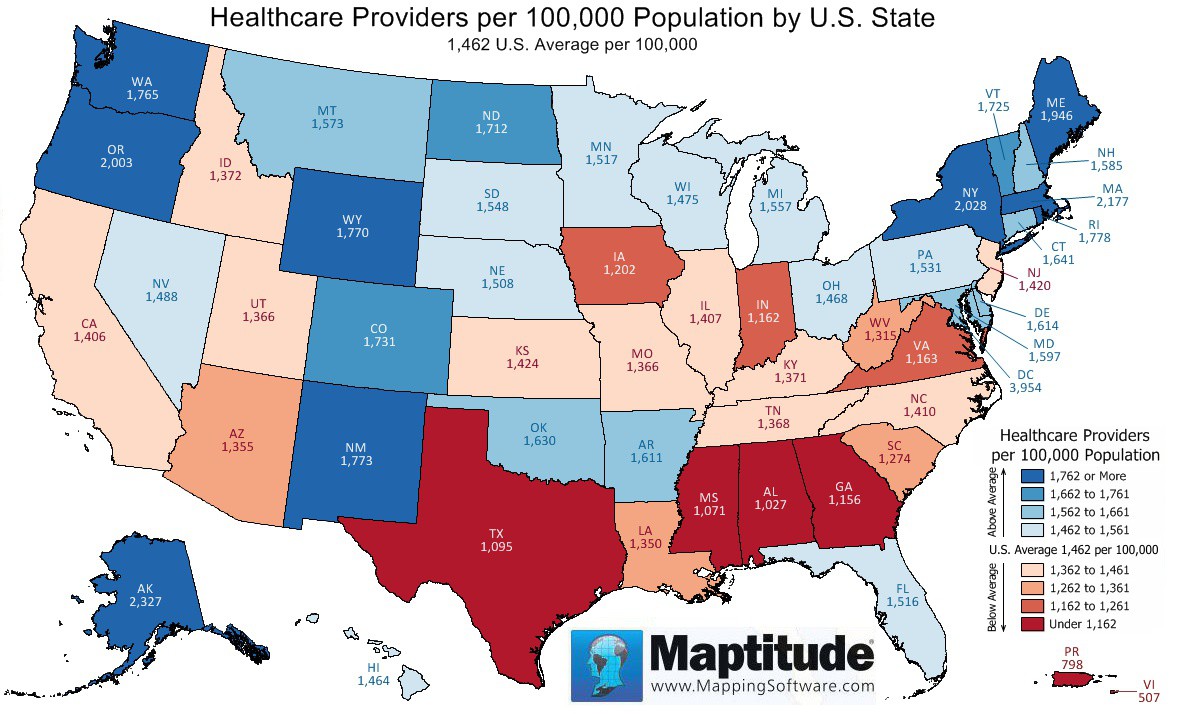
This month's featured map shows the number of healthcare providers per 100,000 people and is drawn from the Maptitude 2017 USA Country Package ZIP Code layer. States with more than the national average of healthcare providers per capita are shown in shades of blue, and states with fewer are shown in shades of red. Washington DC has by far the highest ratio of healthcare providers, followed by Alaska, Massachusetts, and New York. Puerto Rico and VI, Alabama, and Mississippi have the lowest ratios of healthcare providers.
Tech Tip:
How do I use the Export to Excel tools with the free healthcare layers?
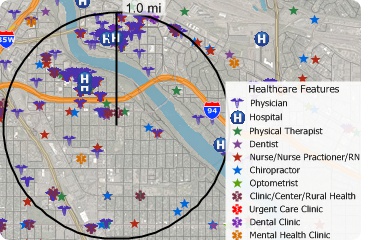
Maptitude 2017 makes it easy to create Excel reports. You can create a radius and quickly see information on all the locations within the circle. This includes locations in all layers apart from those in restricted HERE layers.
Once you have downloaded the free health data here, you can analyze healthcare locations using the export to Excel tools.
This Tech Tip shows how to work with the Radius and Export to Excel tools in Maptitude 2017 to find all of the healthcare providers, clinics, physicians, and/or hospitals within any radius of any location in the United States.
Tricks & Tips:
Create a Color Theme on ZIP Codes for Hospitals, Beds, and Healthcare Providers
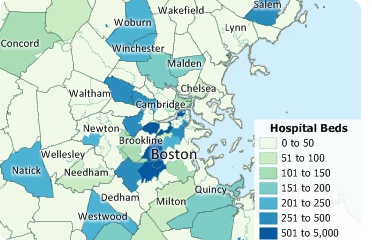
Maptitude 2017 has new and updated data sets. These include the latest ZIP Code boundaries that feature counts for hospitals, hospital beds, and the number of healthcare providers.
Make the ZIP Code layer visible and the working layer in your map (in the Display Manager, right-click on the ZIP Code layer and choose Show Layer, and then right click again to choose Make Working Layer).
Then choose Map > Thematic Mapping > Color. From the bottom of the Field list choose one of the 3 healthcare layers and choose OK. Maptitude displays a thematic map of your chosen variable.
Learning
Free MapPoint Webinar; New Maptitude 2017 Videos; USA Training Dates for Maptitude 2017!

MapPoint Webinar: This webinar will help MapPoint users new to Maptitude 2017. We will discuss mapping your data, changing the styles on a map, getting reports on custom-defined areas, creating drive time rings, the hover label tool and creating territories. There is also a free class handout here.
Upcoming Training:
New 2017 Webinars!
»
Upcoming
webinar schedule and
past webinars
»
Other free mapping and learning resources
| www.caliper.com | Copyright ©2017, Caliper Corporation. All Rights Reserved. |