![]()
![]()
![]()
![]()
![]()
![]()
![]()
Maptitude is a robust and easy-to-use professional health care mapping tool. Maptitude provides all the features that your organization requires in order to take advantage of the geographic elements underpinning successful health care networks and medical services provision.
Maptitude costs only US$695 and is packaged as a one-stop-solution, shipping with all the tools and data required to allow hospital groups, managed care organizations, employer groups, and third party administrators (TPAs) to better operate in the competitive environment for delivering health care.
Analyze populations and their healthcare accessibility.

|
“I have used [Maptitude] exclusively in my health/hospital planning career. It has been indispensable in terms of product quality, affordability and ease of use. I was able to make a variety of custom maps of hospital patient data for executive-level decision support. There is nothing to dislike about Maptitude - it has gotten easier to use over the years and is still the 'best bang for the buck.'”
|
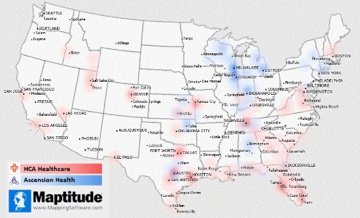
Maptitude is widely used by business intelligence analysts to improve the marketing, sales, and operations of health care organizations. To explore Maptitude further, see examples of mapping analytics and explore the locations of competitors and prospects. Read reviews from your peers in the industry to see how Maptitude is helping improve business decisions.

The dynamics of health and health care provision vary substantially across regions, and Maptitude allows you to map these differences in population density, age distribution, disease prevalence, race, ethnicity, poverty and the ability to access care. Maptitude includes the geocoding and geographic information system (GIS) tools that are critical in linking patient and population locations to local demographics to explore these relationships.
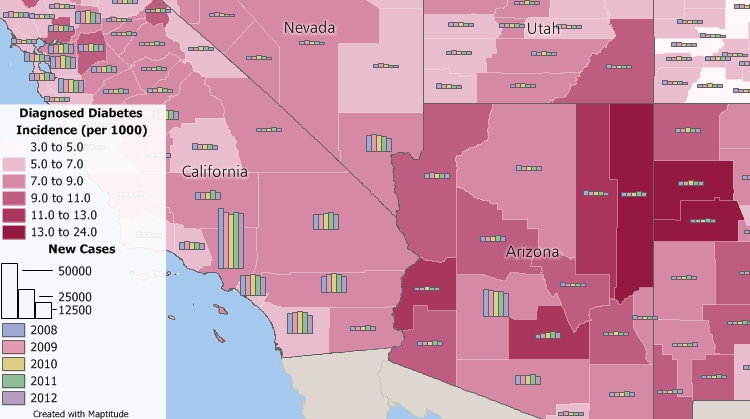
Create epidemiology maps and find geographic patterns in your data.
Wide use of the Maptitude GIS in health care supports research in the fields of public health, disease mapping, and epidemiology. Maps help to visualize health care information and enhance the understanding of the health care landscape. Maptitude mapping software enables users to find data about hospitals, health workers, at risk populations, and more:
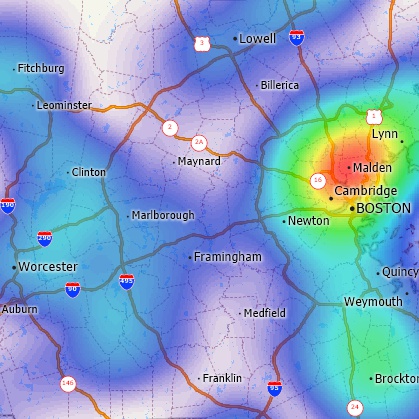
Visualize geographic clusterings and hotspots
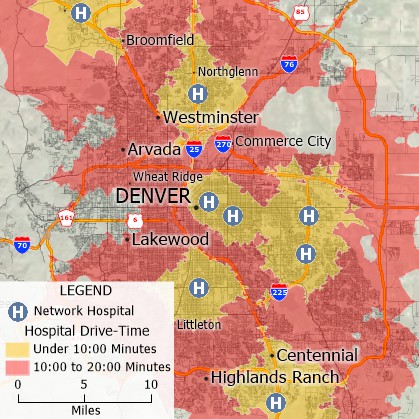
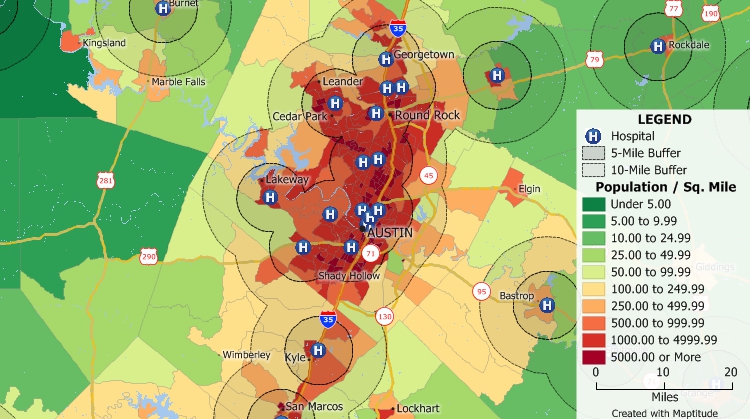
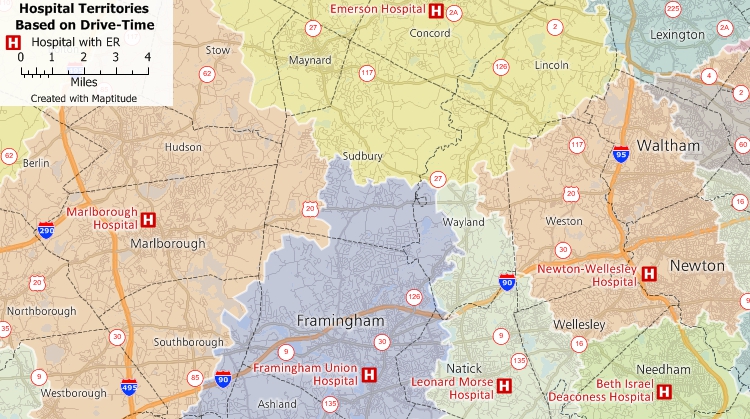
Perform hospital mapping and create territories based on drive-time or distance and look for gaps in service.
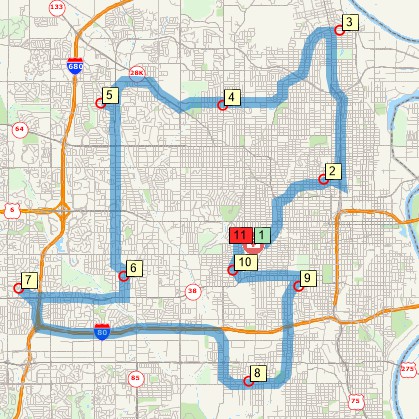
Plan in-home medical services.
Maptitude makes it easy to use maps to analyze and understand the locations of doctors and patients, and can help explore the best location for a new clinic or office. Maptitude is a powerful combination of mapping software and geographic data that provides everything that you need to make informed decisions. Maptitude can help answer questions such as "Where Are My Patients?"
In addition to the latest demographics, Maptitude includes substantial social, housing, and income data, along with easy-to-use analysis tools that will allow you to better understand the relationships between the demand and supply of medical services.
For example, the Maptitude USA Data Package (other countries...) includes comprehensive hospital listing locations, and the number of health care and social assistance employees and establishments for every ZIP Code in the country. These data provide a complete framework for exploring care provider locations.
As costs of delivering health care continue to rise, providers and administrators must do all they can to maximize efficiency and minimize waste. With Maptitude's location-based data and tools, health care planners can select optimal sites to best serve patient populations, achieve equitable service provision, and maximize access to health care.
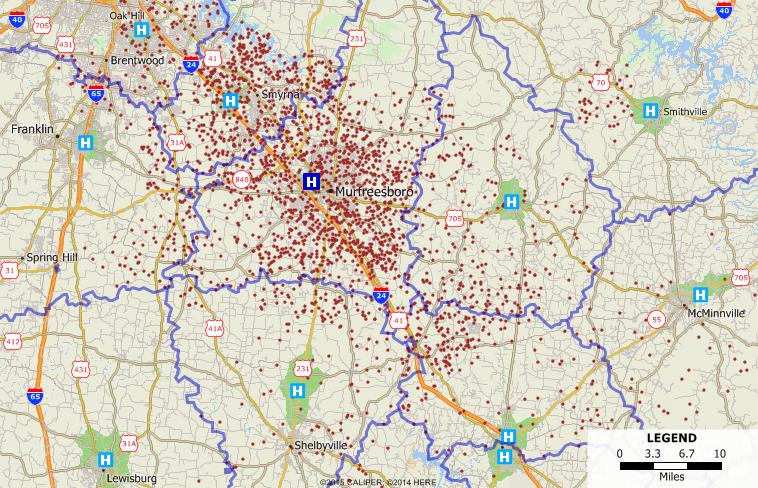
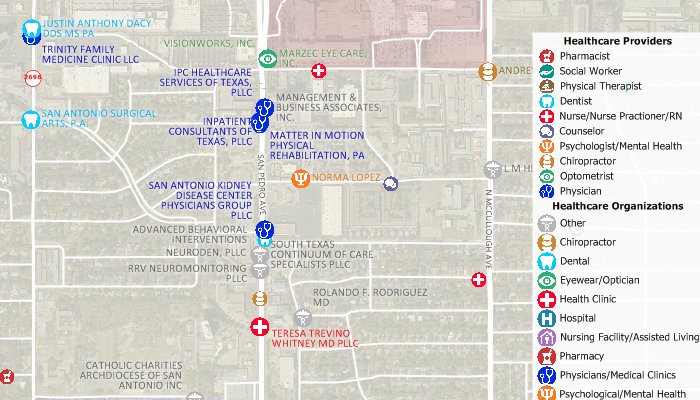
Map patient, doctor, and facility locations.

|
“This is awesome mapping software. We use it to create heat maps of where our patients live. This allows us to intelligently decide where to add services in our area.”
|
Maptitude can help to reduce unnecessary health care related costs and supports location-based decisions for health care services, network expansion, regulatory reporting and risk management.
Maptitude is used in the assessment of unmet health needs which provide a basis for addressing the requirements of a hospital's implementation strategies (community benefit plan), ensuring it is aligned with community needs (see an example case study here).
Many health care organizations and pharmaceutical companies use Maptitude for target marketing, management, and territory planning. For example, using the Maptitude GIS, medical supplies and equipment can be visually located and inventoried. Linking the physical location and condition of equipment or supplies in a large facility or distributed medical campus is a powerful management tool.
Maptitude mapping software gives you a suite of tools for defining care network service areas and for address/postal geocoding and validation. Unlike many other mapping and GIS software that require users to purchase data separately, Maptitude includes extensive geographic and demographic data so that you can get started fine-tuning health care networks as soon as you install the software.
Maptitude includes one free Country Package of your choice. When you get the United States Country Package, you get demographic data from the state level all the way down to the Census Tract level. These data include population, income, and poverty variables, as well as fields describing the population with public, private, and no health coverage (both totals and by employment status), and the population with disabilities (by age group). See the U.S. Demographic Data tab on the United States Country Package page for more information.
Caliper also offers five additional health related data sets for free to Maptitude users. These data include the locations of hospitals, health clinics, other health care facilities, physicians, and other health care providers. These data are in Caliper's geographic file format and require Maptitude mapping software to open them.
Download free data for use with Maptitude health mapping software.
There are many additional areas where Maptitude can help health care providers meet compliance requirements:
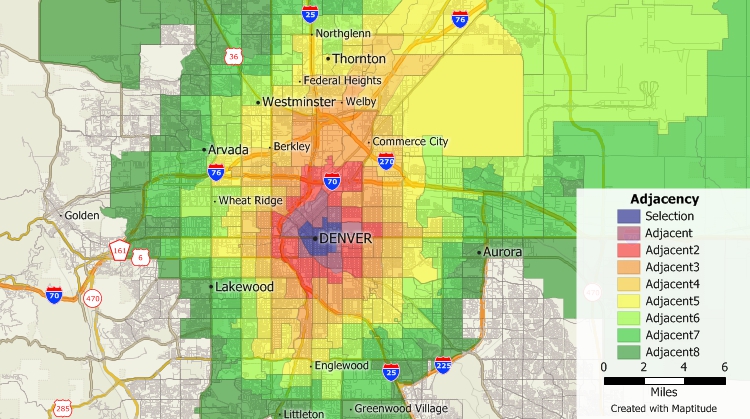
Create maps showing Nth order adjacencies and compute statistics based on level of adjacency.
Maptitude can be used for health care mapping in many countries including the USA, Canada, UK, Australia, and in many additional locations (more data...).
Maptitude starts at only US$695 and is packaged as a one-stop-solution. Maptitude remains the most competitively priced professional health care mapping software available and is unique in the marketplace for the provision of comprehensive data and functionality in a single product for a single low price.
Learn more about Maptitude mapping software
Links to public health research utilizing Maptitude
CASE STUDY: Creating a Mapping Project for Physicians Strategic Planning Retreat
Still have questions? Contact Maptitude Sales today at: sales@caliper.com or call +1 617-527-4700.
 |
“As the Primary Care Association for Florida, we are able to map Community Health Center locations and overlay surrounding data built into Maptitude to assist in planning and responding to the needs and social determinants of health for over one and a half million patients, as well as all Floridians (everyone is eligible to be an FQHC patient). The ability to import data and simultaneously look below the surface to map transportation, economic conditions, and other key demographic characteristics provides an additional means by which Health Centers can strategize and implement action plans in addressing the health and environment in/around their service areas. This tool is very powerful, once able to harness the full extent of its scope.”
|

|
“I teach GIS and public health classes at the University of Washington, I have also taught short courses using other GIS software. I have settled on Maptitude for four reasons....READ MORE 1. Analysis. Maptitude allows for the generation of the adjacency matrix that is key to doing any spatial statistical analysis. Maptitude provides for querying the neighbors of an area. You can then produce statistics on the neighbors and the distance between areas. 2. Functionality. Maptitude has extensive functionality including powerful spatial query, database capabilities, 3D mapping, and route selection. Maptitude supports many different GIS formats which are simply not available in other GIS software packages without spending a lot of extra money. You can also utilize external data from the Internet, convert to any projection/coordinate system, and make superb maps. 3. Ease-of-use. Maptitude has a significantly flatter learning curve than other GIS software packages I have worked with. Investigators can come back to Maptitude two weeks later and remember what they need to know to pursue a solution to their problem. GIS is not simple but Caliper seems to be trying to make it as available to ordinary human beings as possible. Maptitude satisfies the casual user, such as a public health practitioner or a spatial statistician, as well as the fully qualified GIS technician. Investigators who are juggling database programs, statistical packages, the operating system, not to mention the scientific issues of a project, need as little hassle from their GIS as possible. I think Maptitude gets pretty close to this ideal. 4. Cost. You get a fully functional GIS and extensive data for 1/3 the price of other GIS products or your statistical package. Most graphics packages cost more than Maptitude."
Dr. Richard Hoskins |
 Check out our G2 Reviews