With TransCAD, you can create high-quality map output using dozens of thematic mapping styles and options, unlimited colors, and fully-scalable line styles and TrueType map symbols. With a few clicks of the mouse, MapWizard® automatic mapping technology helps you create color and pattern coded maps, dot-density maps, scaled-symbol maps, and maps with integrated pie charts and bar charts. TransCAD also provides specialized mapping functions for transportation applications:
Additional tools let you visualize data that cannot be displayed using a conventional GIS:
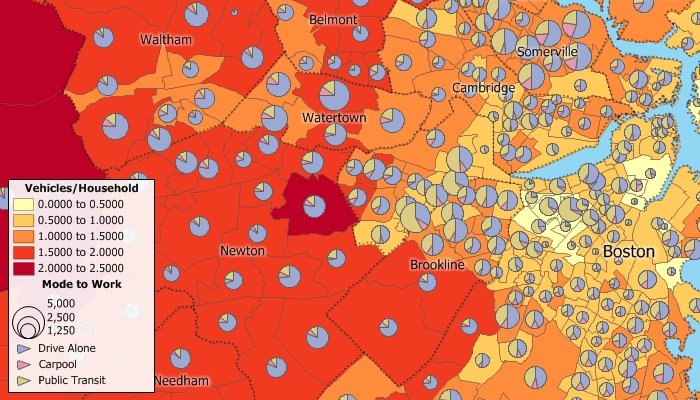
Create color, pattern, chart, dot-density, and scaled-symbol thematic maps
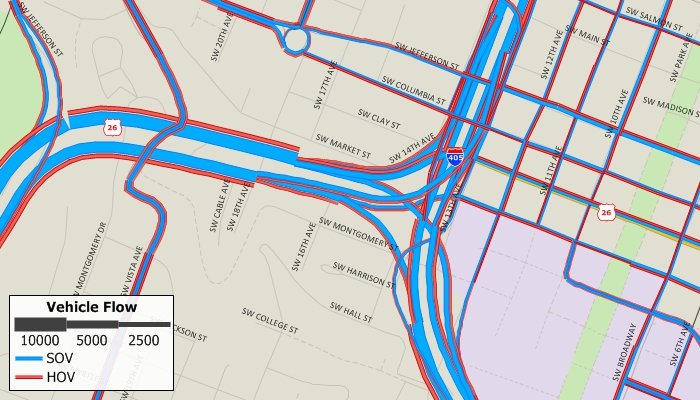
Create multi-variable scaled-symbol themes on links
Display one-way streets and use dozens of line styles and highway shields
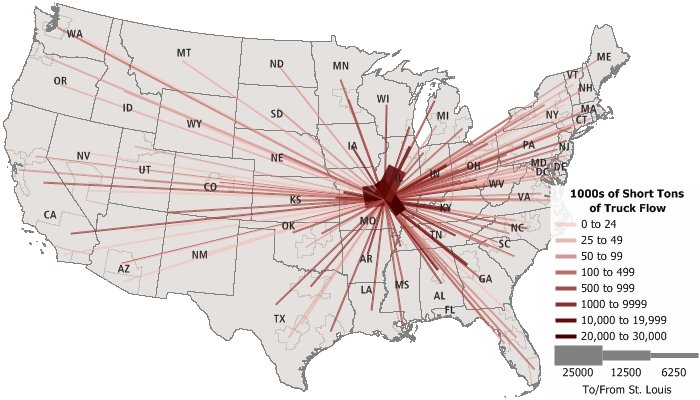
Use desire lines to illustrate O-D flows, commodity flows, and other matrix data
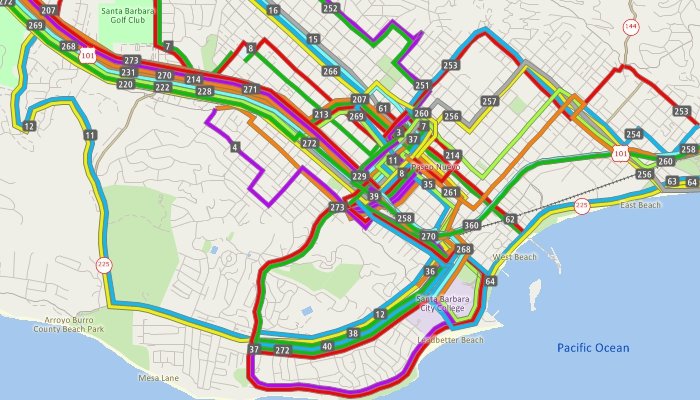
Display transit routes side-by-side over the links that they traverse
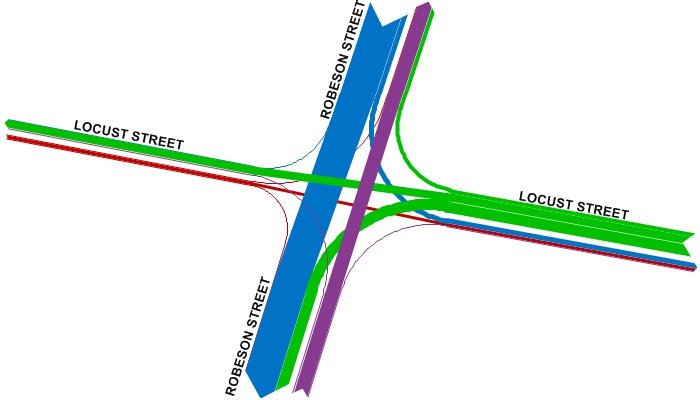
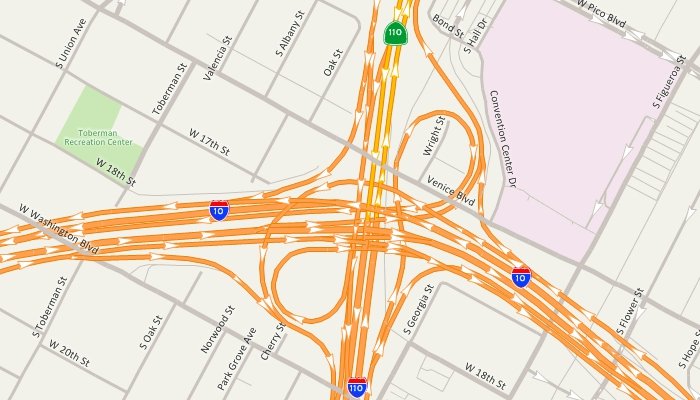
Show turning movement data with intersection diagrams
Tables: You can see the data associated with map features in tabular form. See data for a single feature, or display data for an entire layer in a dataview. You can use dataviews to add and delete records, filter records, edit values, create formula fields, or compute statistics.
Output: Page layout tools help you design and create professional presentations that combine the results of your analyses into a single powerful display. You can print your maps and layouts on any printer or plotter, or save them to vector or raster formats. You can also save your work as JPEG or PNG files for use on a web page.