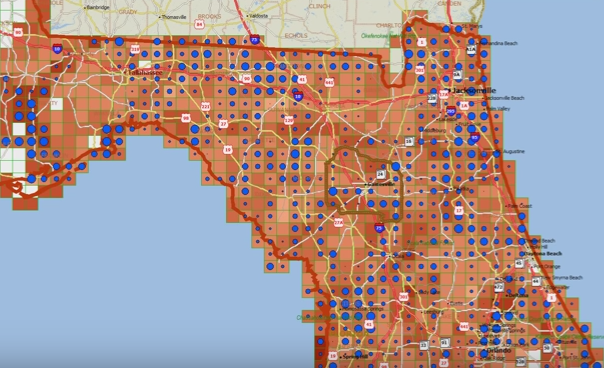
This map shows a color theme of wind and a scaled symbol theme of pressure based on historical hurricane track vector data. The map comes from Prof. Grant Thrall's video, Part 2: Vector To Raster Grid Conversion: Calculation of Risk to Real Estate.
See more map infographics Learn more about Maptitude
Featured Maptitude Mapping Software Map: June 2013
Created by: Prof. Grant Ian Trhall