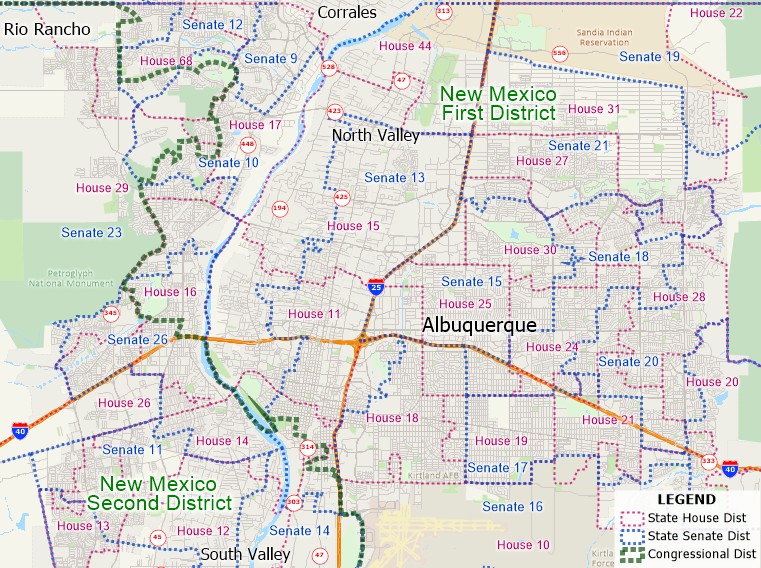
Household Median Income
Households
HH_Income <$10K
HH_Income $10K-14,999
HH_Income $15K-19,999
HH_Income $20K-24,999
HH_Income $25K-29,999
HH_Income $30K-34,999
HH_Income $35K-39,999
HH_Income $40K-44,999
HH_Income $45K-49,999
HH_Income $50K-59,999
HH_Income $60K-74,999
HH_Income $75K-99,999
HH_Income $100K-124,999
HH_Income $125K-149,999
HH_Income $150K-199,999
HH_Income $200K+
Households English Spoken
Households Spanish Spoken
Spanish no English Spoken
Spanish and English Spoken
Households Other Indo-European Spoken
Other Indo-European no English Spoken
Other Indo-European and English Spoken
Households Asian Spoken
Asian no English Spoken
Asian and English Spoken
Households Other Spoken
Other no English Spoken
Other and English Spoken
Families
Family Income <$10K
Family Income $10K-14,999
Family Income $15K-24,999
Family Income $25K-34,999
Family Income $35K-49,999
Family Income $50K-74,999
Family Income $75K-99,999
Family Income $100K-149,999
Family Income $150K-199,999
Family Income $200K+
Median Family Income
HH Aggregate Income
HH Aggregate Income White
HH Aggregate Income Black
HH Aggregate Income Am Indian
HH Aggregate Income Asian
HH Aggregate Income Hawaiian
HH Aggregate Income 2+ Races
HH Aggregate Income Non Hispanic White
HH Aggregate Income Hispanic
Housing Units
1-Unit Detached
1-Unit Attached
2-Units
3-4 Units
5-9 Units
10-19 Units
20+ Units
Mobile Home
Boat/RV/Van
Built 2005+
Built 2000-2004
Built 1990-1999
Built 1980-1989
Built 1970-1979
Built 1960-1969
Built 1950-1959
Built 1940-1949
Built 1939 or earlier
1 Room
2 Rooms
3 Rooms
4 Rooms
5 Rooms
6 Rooms
7 Rooms
8 Rooms
9+ Rooms
Median Rooms
0 Bedrooms
1 Bedroom
2 Bedrooms
3 Bedrooms
4 Bedrooms
5+ Bedrooms
Moved in 2005+
Moved in 2000-2004
Moved in 1990-1999
Moved in 1980-1989
Moved in 1970-1979
Moved in 1969 or earlier
Heated with Gas
Heated with Bottled/Tank/LP Gas
Heated with Electricity
Heated with Fuel Oil/Kerosene
Heated with Coal/Coke
Heated with Wood
Heated with Solar Energy
Heated with Other Fuel
Heated with No Fuel
Lacking complete plumbing
Lacking complete kitchen
Lacking telephone service
Occupants/Room
1 or less
1.01-1.5
1.51+
Males Age 15+
Never Married
Now Married
Separated
Widowed
Divorced
Females Age 15+
Never Married
Now Married
Separated
Widowed
Divorced
In School Age 3+
In Nursery/preschool
In Kindergarten
In Elementary
In High School
In College/grad school
|
Age 25+ Level of Education
<9th Grade Education
9th-12th Grade, no diploma
High School Grad
Some College, no degree
Bachelor's Degree
Graduate/Professional Degree
Percent High School Grads or Higher
Percent Bachelor's Degree or Higher
Owner Occupied Housing Units
Value <$50K
Value $50K-99,999
Value $100K-149,999
Value $150K-199,999
Value $200K-299,999
Value $300K-499,999
Value $500K-999,999
Value $1,000,000+
Median Owner Occ Housing Unit Value
Housing Units with Mortgage
With monthly owner costs <$300
With monthly owner costs $300-499
With monthly owner costs $500-699
With monthly owner costs $700-999
With monthly owner costs $1000-1499
With monthly owner costs $1500-1999
With monthly owner costs $2000+
With costs as % of income <20%
With costs as % of income 20-24.9%
With costs as % of income 25-34.9%
With costs as % of income 35%+
With costs as % of income Not computed
Median selected monthly owner costs
Housing units w/o mortgage
With monthly owner costs <$100
With monthly owner costs $100-199
With monthly owner costs $200-299
With monthly owner costs $300-399
With monthly owner costs $400+
With monthly owner costs Median
With costs as % of income <10%
With costs as % of income 10-14.9%
With costs as % of income 15-19.9%
With costs as % of income 20-24.9%
With costs as % of income 25-29.9%
With costs as % of income 30-34.9%
With costs as % of income 35%+
With costs as % of income Not computed
Occupied units paying rent
With rent <$200
With rent $200-299
With rent $300-499
With rent $500-749
With rent $750-999
With rent $1,000-1,499
With rent $1500+
With no rent
Median Rent
With rent as % of income <15%
With rent as % of income 15-19.9%
With rent as % of income 20-24.9%
With rent as % of income 25-29.9%
With rent as % of income 30-34.9%
With rent as % of income 35%+
With rent as % of income Not computed
Civilian Population Age 18+
Civilian Population Age 18+ Veterans
Age 5+ Language Spoken
English Only
Other Language
Spanish
Indo-European
Asian
Other
Workers Age 16+
Drove alone
Carpooled
Public Transportation
Walked
Other Means
Worked at Home
Employed Civilian Population Age 16+
Occ: Managerial/Prof
Occ: Service
Occ: Sales/office
Occ: Natural res/Construction/Maintenance
Occ: Prod/Transportation/Materials
Ind: Agriculture/Forestry/Fish/Mine
Ind: Construction
Ind: Manufacturing
Ind: Wholesale Trade
Ind: Retail Trade
Ind: Transportation/Warehouse
Ind: Information
Ind: Finance/Insurance/RE/Rental
Ind: Prof/Scientific/Admin
Ind: Education/Health/Soc Services
Ind: Art/Entertainment/Rec/Acc/Food
Ind: Public Administration
Ind: Other
Workers: Private wage/Salary
Workers: Government
Workers: Self-Employed
Workers: Unpaid Family
Travel Time to Work
<5 Min
5-9 Min
10-14 Min
15-19 Min
20-24 Min
25-29 Min
30-34 Min
35-39 Min
40-44 Min
45-59 Min
60-89 Min
90+ Min
Vehicles
Housing Units with 0 Vehicles Available
Housing Units with 1 Vehicle Available
Housing Units with 2 Vehicles Available
Housing Units with 3+ Vehicles Available
|