Using Maptitude tools such as Buffers or Drive-Time Rings, you can calculate custom demographics for your area of interest. The “Overlay” is used to estimate the attributes of an area by superimposing its boundary over the boundaries of other, smaller, areas and calculating the extent to which they overlap. This article will explain how this process works.
See the figure below. We want to see the demographics for the dashed central overlay area, but we only have population data at the level of the colored blocks.
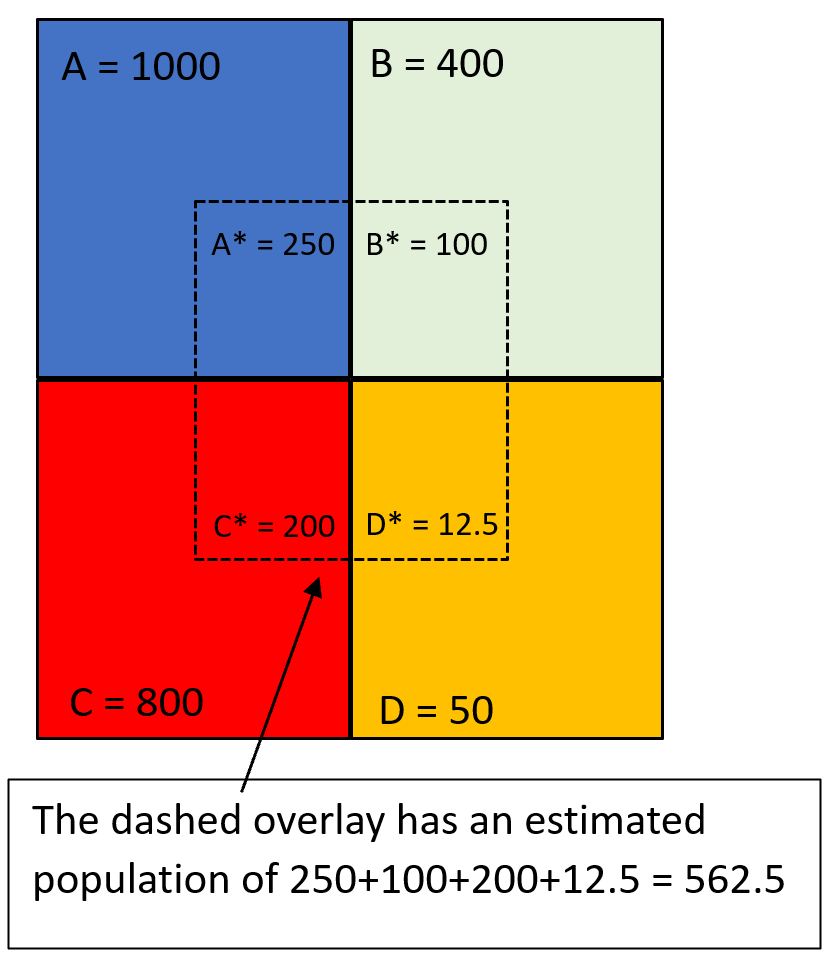
The Maptitude Mapping software uses a method referred to as “proportional overlay” to calculate values for these situations. To do this, it is assumed that the data is evenly distributed across each colored block. The area of overlap between the colored block and the dashed area is calculated and the proportion of the value inside the calculated area is then used in determining the total value of the dashed area.
This method is used when estimating the demographics of rings, territories, or other area layers. The underlying values that are calculated could use any area layer or point database, such as Census Tracts, Block Groups, Blocks, ZIP Codes, or even the user’s own point data.