When using labels to show your data on the map, unformatted data can look untidy and make it hard to understand what the data is meant to be representing. This article will go over how you can reformat the data so that it looks more presentable and descriptive.
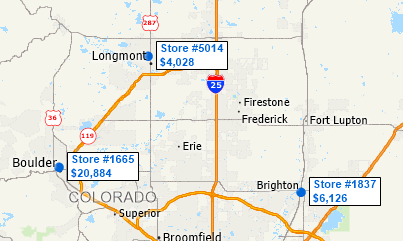
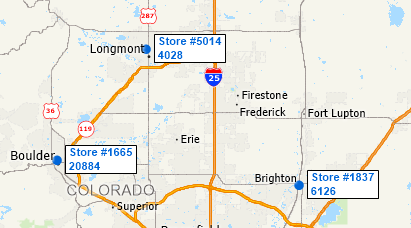
In this example, I have tried to add labels to my points that show the Store Number, and Total Sales for that store (For help setting up the labels initially, see Working with Labels on Maptitude Maps). Unfortunately, my sales information is not formatted as a dollar amount and so the number is not very helpful.
These steps will go over how to reformat the data so that the data is clearer. In my example, the layer is called Stores and the field that I want to reformat is called Total Sales:
- In the Display Manager, right-click on Stores and choose New Dataview
- In the resulting dataview, right-click anywhere and choose Field Properties
- Scroll down to Total Sales
- From the Format column, choose the formatting you want:
- To format as whole dollar amounts, choose $12,345
- To format as dollars and cents, choose $12,345.12
- To format as a different currency, choose the relevant option
- To format as a percentage choose 12% or another option with the correct number of decimal places
- Click OK
- Go back to the map.
- If you have labels already applied, click on the labels icon next to Stores and click Remove
- Click on the labels icon next to Stores and set up labels using the newly formatted field
- Working with Labels on Maptitude Maps will help with available label options