You can summarize the USA Country demographic projections with demographic mapping software.
The new U.S. county level projection data contains numerous fields of population data by year, age, gender, and race. You can combine multiple fields (such as all the fields containing “2050” in their name) to create a total field (e.g., total 2050 population).
The following steps outline how to create a formula field that summarizes many fields:
- Add the county projections layer to a map and make it the working layer.
- Right-click on County Pop Proj in the Display Manager and choose New Dataview.
- Click
 on the Standard toolbar.
 - Click Statistics.
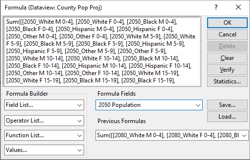
- Make sure that Sum is chosen in the Statistics drop-down list and click Choose Fields.
- On the left side, highlight the fields you want included in the sum and click Add>>. You can use the filter to naroow down the left side.
- Click OK.
- Click OK.
- In the Formula Fields editable drop-down list, type a name for the summary field.
- Click OK. Maptitude adds a field to the dataview that contains the sum of all of the fields you chose.
For more information on visualizing and analyzing demographic projections, please see the Maptitude tutorial article on visualizing time series data.