You can map housing market data using real estate mapping software.
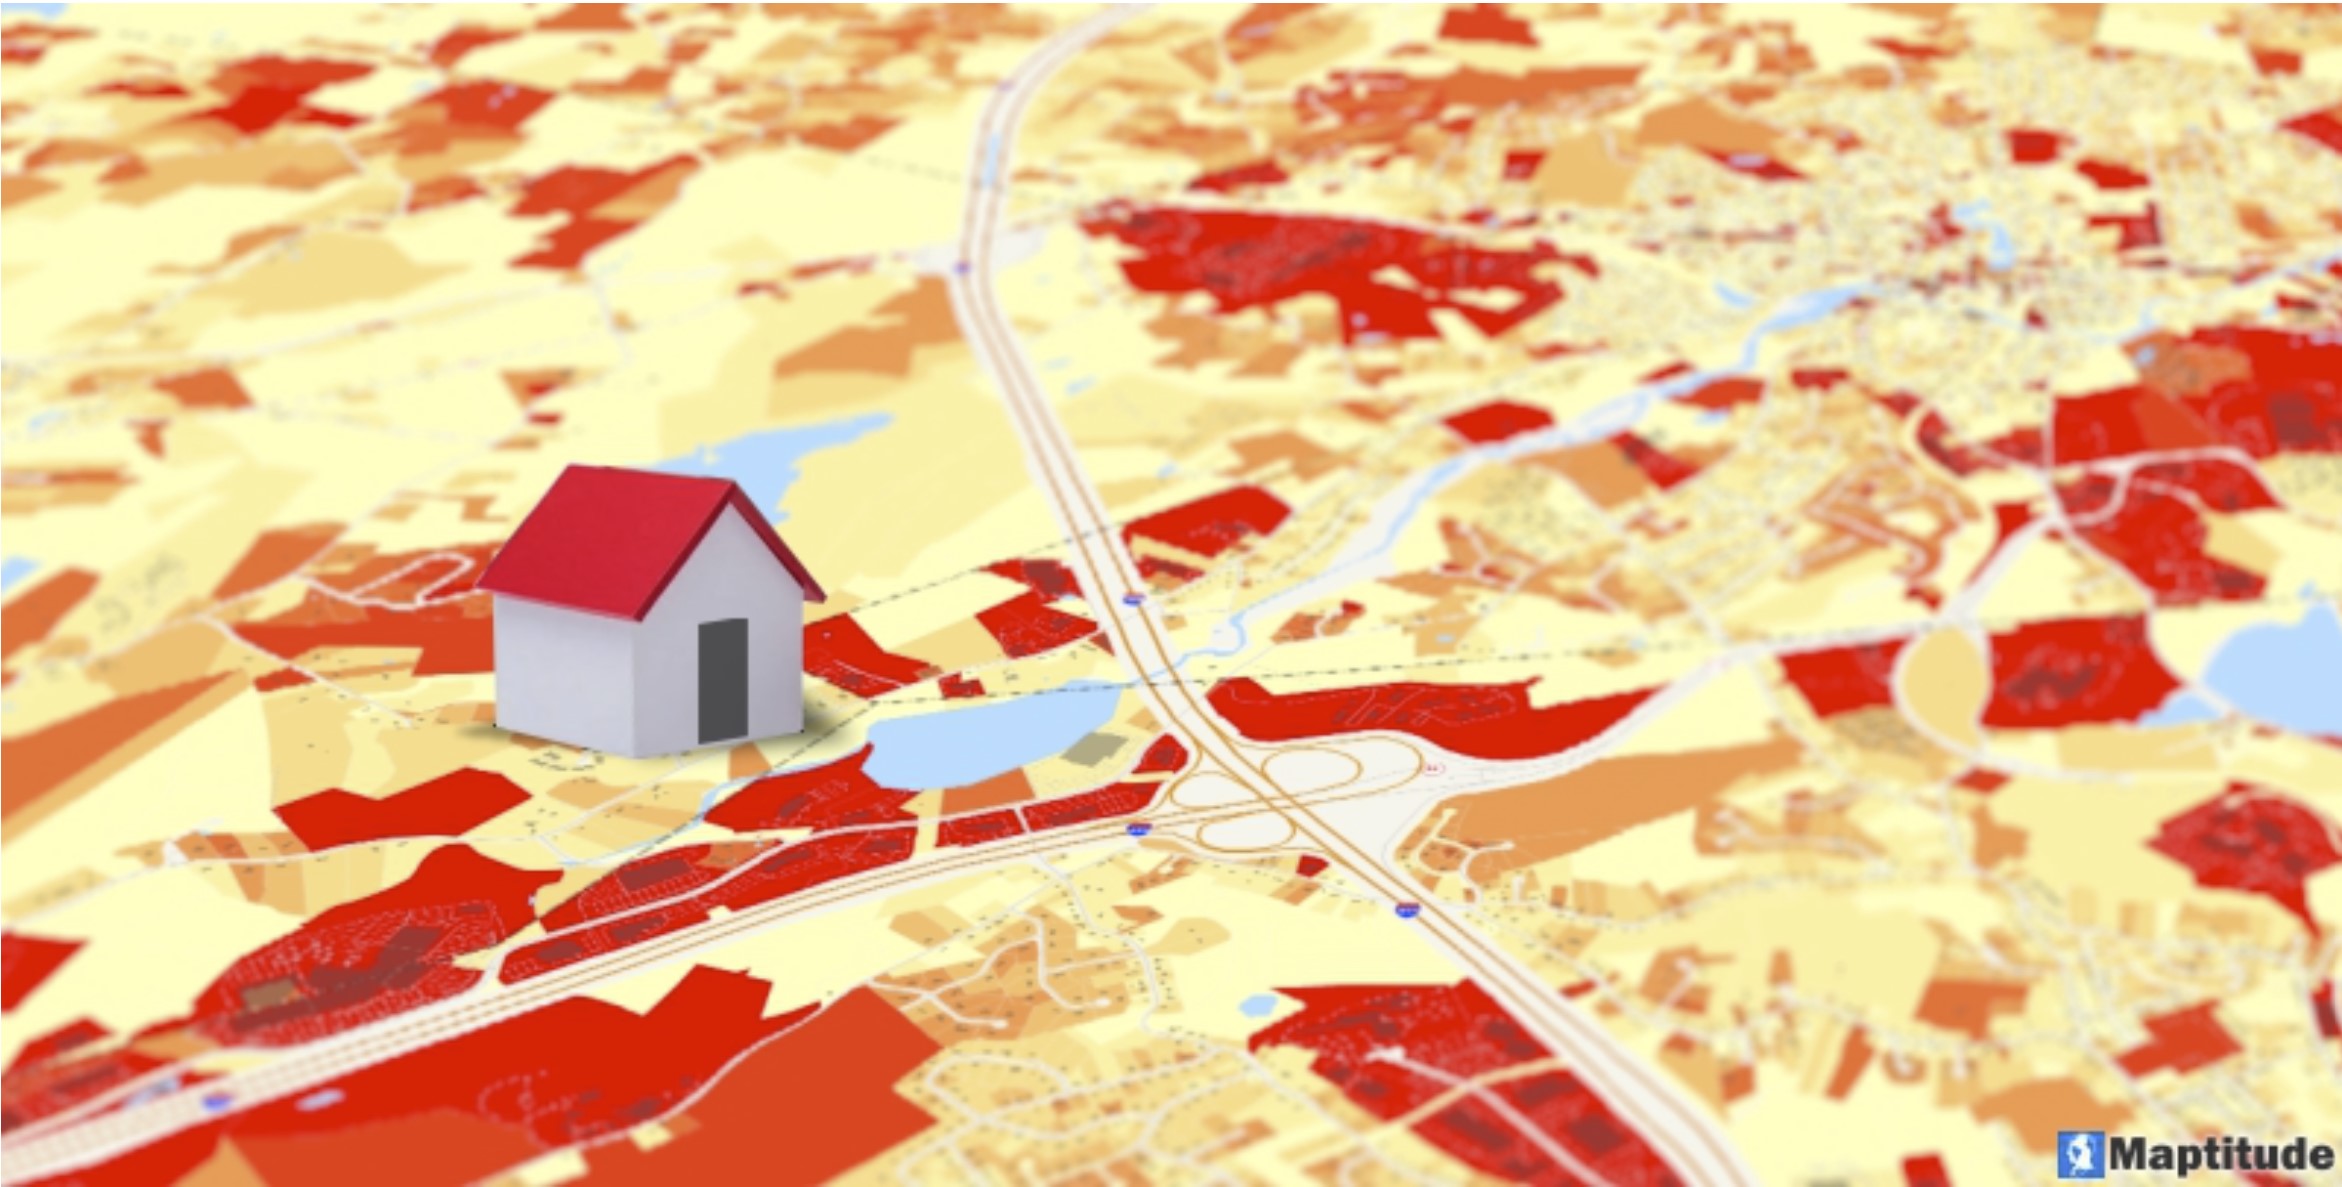
Maptitude mapping software can aid in the mapping and analysis of the housing market, allowing you to explore housing market trends and home valuation data.
Housing that is both high-quality and financially attainable is vital to a family’s well-being. However, housing costs in some locations are so high that many families are unable to afford this necessity. Housing prices fluctuate depending on market circumstances and vary throughout the country necessitating analytical tools that can handle large amounts of data at varying geographical levels to build a comprehensive picture of the housing market.
There are many ways to explore housing data in Maptitude that range from 2D 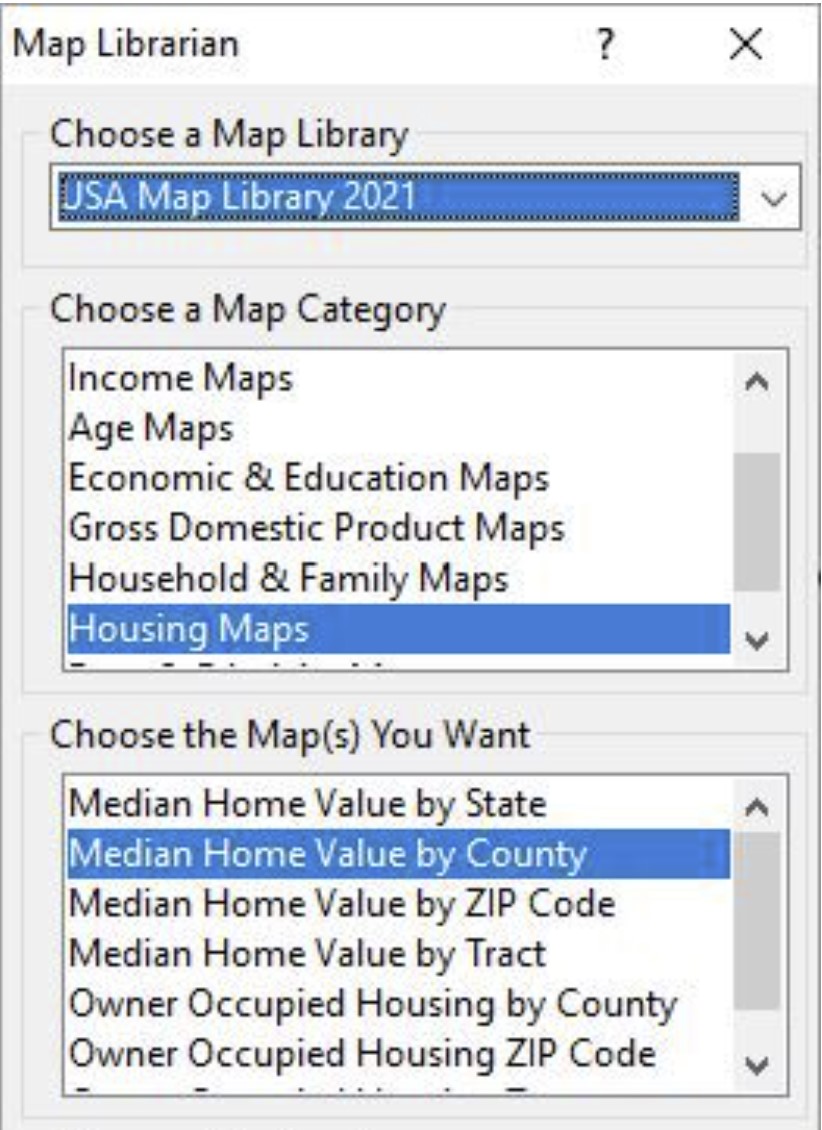 and 3D maps to charts and tables. The easiest way to access the data is simply to browse to Map>Demographic Map Librarian and then choose from the list of maps available for Median Home Value & Owner-Occupied Housing. Here are some additional resources regarding the ways in which you can further explore housing data with Maptitude:
- What census data is there for housing market data?
- What is Construction Valuation and how can I map it?
- What is the Housing Price Index and how can I map it?
- How can I see the number of building permits by area?
How We Can Help
Maptitude lowers the burden required for a successful real estate mapping analysis, project, or report. By integrating with key geographic, demographic, and housing datasets, Maptitude provides a one-stop wizard-driven interface. Maps are an intuitive way to convey and analyze large amounts of data. Maptitude support all the above analytics and can access all the data used in the examples shown, as well as information for almost any industry and sector you need to map.