Maptitude includes a large number of fields of data on age of householder by household income. The householder income data is accessible on most of the boundary layers included with Maptitude.
The following steps describe how to create thematic maps using this data:
- From the Home Window, choose New map of United States and click OK.
- Choose United States from the scroll list or a different option if you want a map zoomed to a specific location. Click Finish.
- Make the layer on which you want to create the thematic map the working layer.
- Choose Map>Thematic Mapping>Color or click
 on the Standard toolbar to display the Color Theme dialog box.
 - Click on the Field drop-down list and type hher. This filters the list of fields by householder fields.
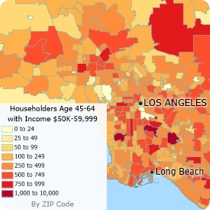
- Choose one of the Income fields. The Color Theme Wizard fills in all of the other settings in the dialog box.
- Click OK. Maptitude will color your chosen layer based off of the selected field.