You can use your own data in a demographic report using demographic software.
When running a radius analysis or a drive time ring report, the tool is set up by default to use the demographic data that comes with the software. If you have added your own data, however, you can use this data in your report instead. These methods will also be applicable with one of the additional data sets you have downloaded and added to your map such as the ZIP Code Business Patterns, or Business Locations data.
This article will walk through the steps for generating a demographic report for your data from a Buffers Analysis or a Drive Time ring. In this method, we will use the Maptitude sample sales data which has been attached to the ZIP Code layer. Attaching data in this way is covered in the Mapping My Own Data tutorial. The starting point for these steps is having a ZIP Code layer with additional fields for QTR1 Sales and QTR2 Sales, and the goal is to estimate these sales with a demographic report for a radius or drive time.
- Download a free mapping software trial of Maptitude Desktop or use your existing Maptitude Desktop license.
- For Drive Time rings, click Options
 and then Configuration
  . For Buffers analysis, check Calculate Demographics and click Configuration . You will be presented with the Demographics Settings window.
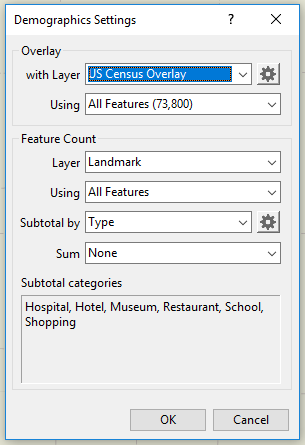
How Do I Use My Own Data in a Demographic Report? Demographics Settings. - Under the Overlay frame, select the layer that you would like to extract the data from. For this example, I chose 5 Digit ZIP Code.
- Click Aggregation Settings
 .
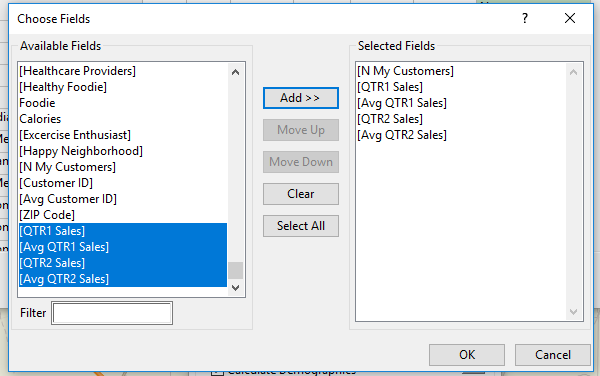
. - Click Clear to reset the fields to be used so that you can choose your own.
- Click Filter to pick the fields you want to include. You want to include on the right-hand side all the fields that you want to include in the report. Click Clear to empty the Selected Fields and then highlight the fields to include and click Here I am choosing N My Customers (Total number of customers) as well as total and average sales for QTR1 and QTR2.
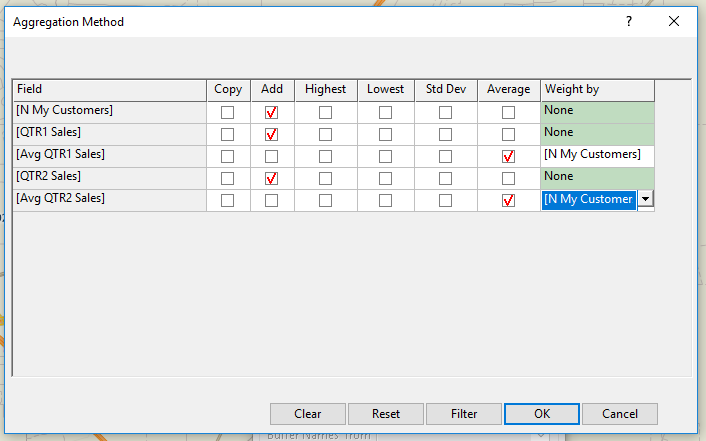
How Do I Use My Own Data in a Demographic Report? Choose Fields Settings. - Pick an aggregation method for each field to include. See Which Aggregation Method Should I Choose? for a more detailed instruction on how to pick the method used, but the general idea is to check Add for fields that are totals, like QTR1 Sales, and Average for fields that are averages, like Average QTR1 Sales. When using Average, you need to select a Weight By field so that the average is weighted further towards the areas with more data.
How Do I Use My Own Data in a Demographic Report? Aggregation Method Settings. - Click OK.
- Click OK.
- For Drive Time Rings, create your rings and click Calculate Demographics
 . For Buffers Analysis, set up your Buffers settings and click OK.
 - The software will perform the analysis and output a demographic report with the fields from your data.
To learn more about other kinds of reports, please see the Maptitude article on mapping reports.