When creating certain types of map using your own data, Maptitude allows you to set up a Link to the source data so that you can easily update the map to reflect any data changes. This article will not go over how to set up this link, which is covered in detail here, but just talk about when you can use this functionality.
There are two types of data that can be set up with a live link:
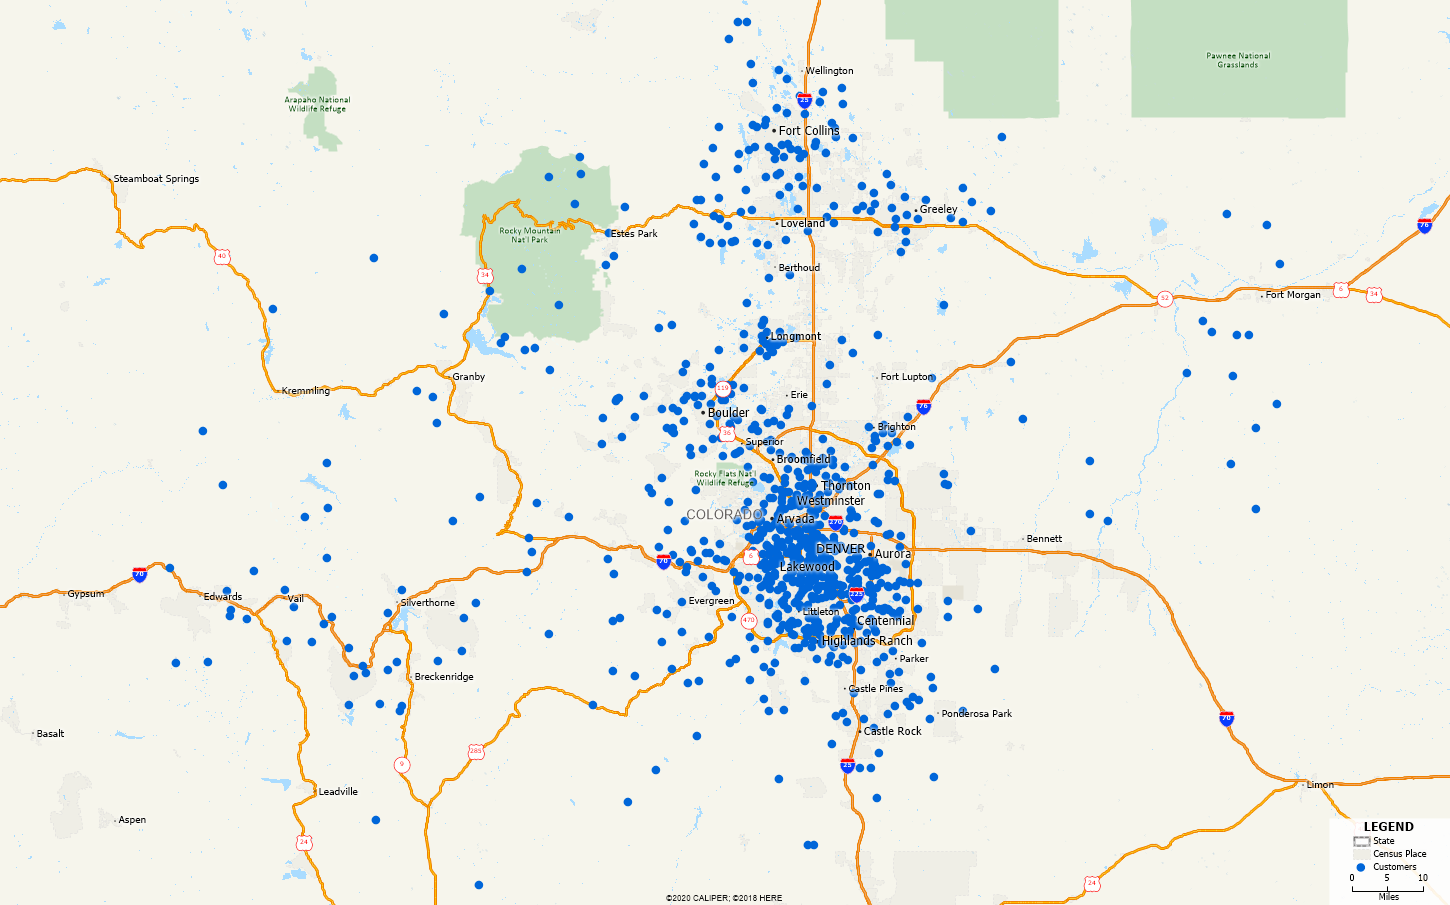
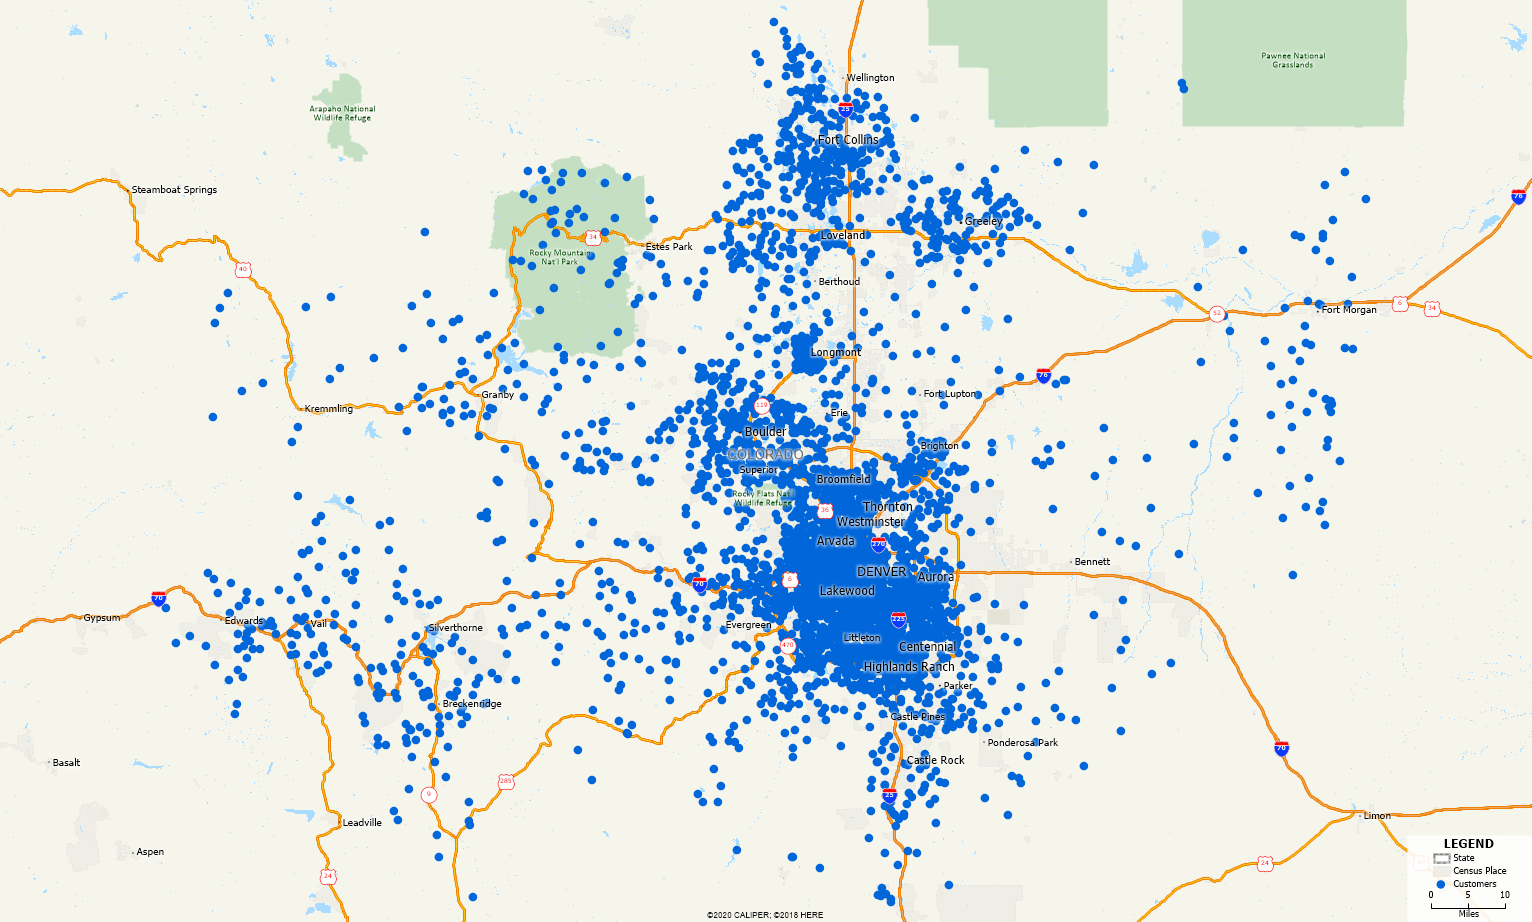
- A point layer of geocoded locations (often called a Pushpin Map)
- An area layer with your data attached to it (often called a Heat Map)
With either of these options, you can link to multiple data sources in the same map. For example, you could have two linked point layers in the map, layered on top of a heat map showing your sales data by ZIP code, which is also linked. To check what linked layers you have in the map, as well as what files they are linked to, you can go to Map>Linked Records Settings…
Pushpin Map Linking
When you locate a list of addresses from a file, such as an Excel list, you can link the file so that any changes are reflected in the map. This includes adding new records, deleting old records, changing addresses or updating values such as sales amounts:
To do this, the source data needs to have a unique ID number for each record. If Maptitude is not recognizing your file, see: https://www.caliper.com/learning/articles/why-cant-i-use-the-live-link-functionality-with-my-data/
Heat Map Linking
If you join your data to an existing geographic area layer and apply a theme, e.g. showing a Color Theme of Sales by ZIP Code, then you can also link the file so that any changes are reflected. Any changes made to the source data that affect the totals for the areas, such as adding records, deleting records or updating values will be reflected in the map and the theme will change accordingly.
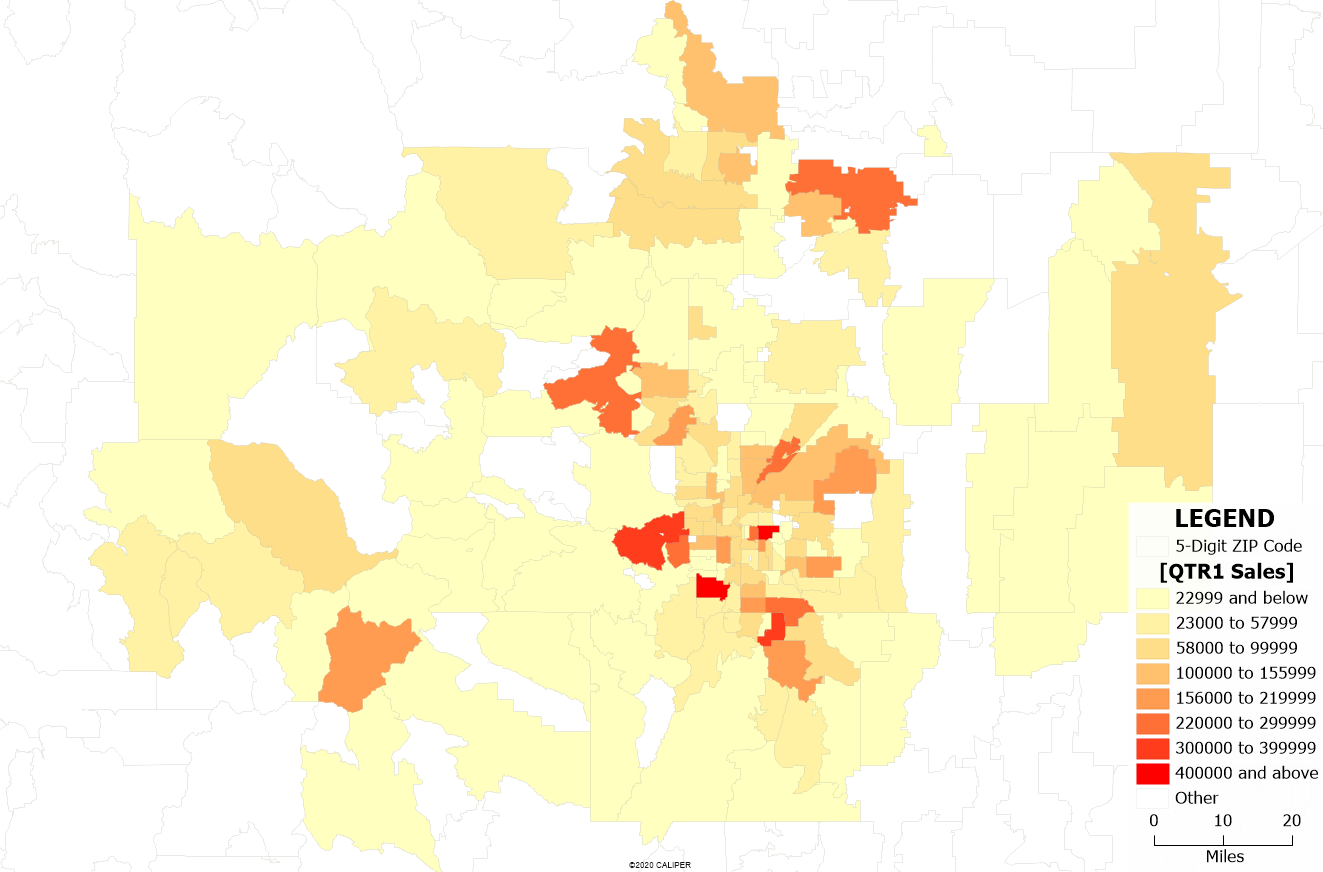
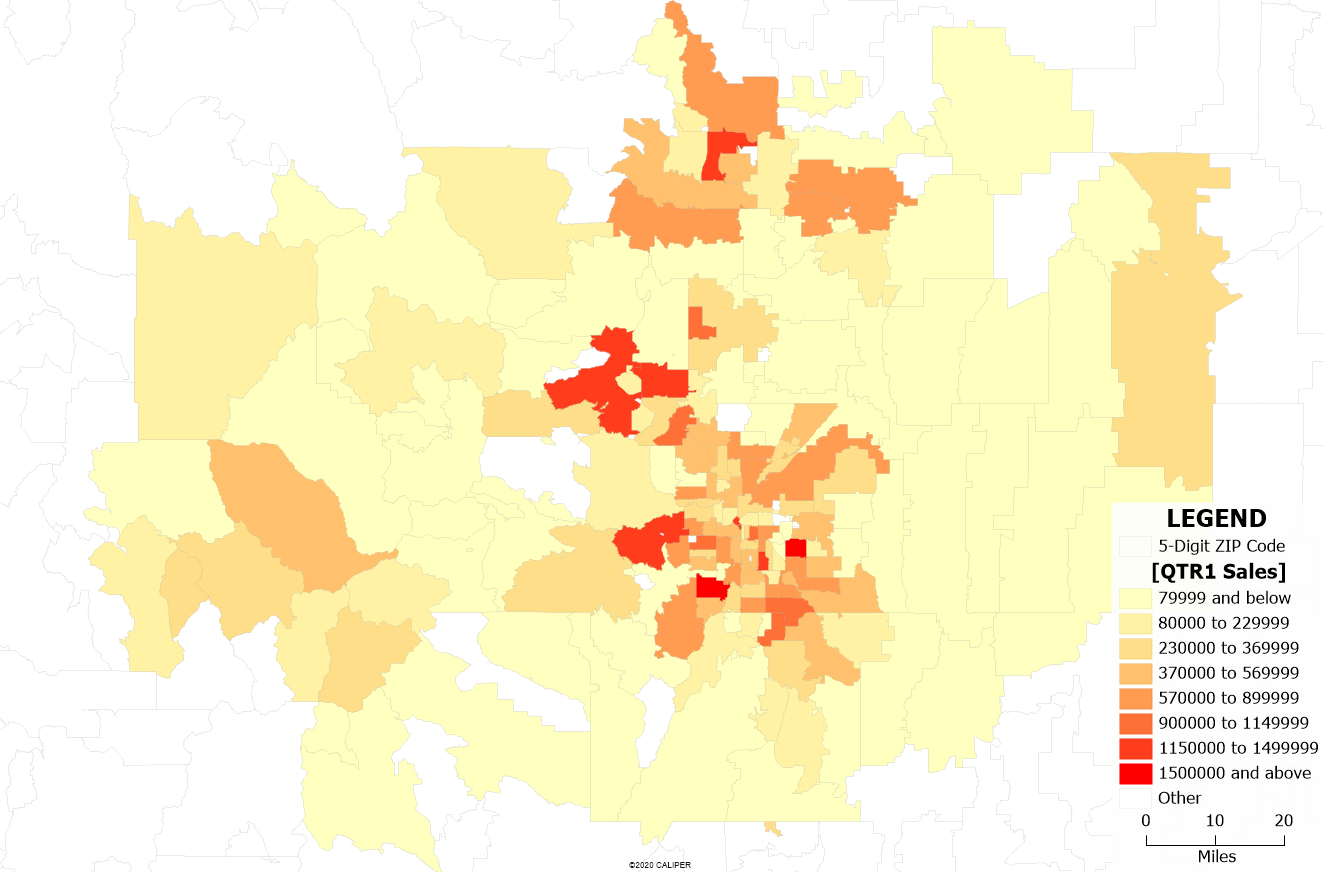
See how in this example the ranges for the theme need to be updated since the totals have changed so significantly.