Maptitude Help / Routing, Directions, and GPS / Creating Distance and Travel Time Tables
Creating Distance and Travel Time Tables
You can create a table that shows the drive time or distance, or Euclidean straight-line distance, of features from one or more origins in a point or area layer to destination features in the same layer or another point or area layer. You can choose to see the resulting table with records for each origin-destination pair or as a matrix.
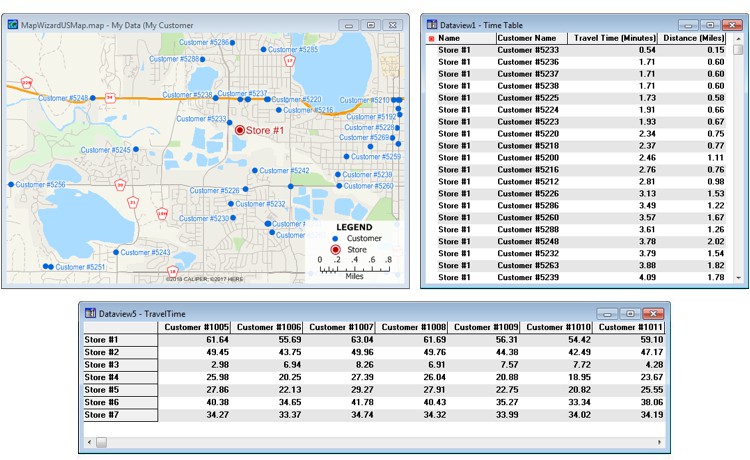
You also have the option of specifying a maximum drive time or distance. For example, you can find all of your customers within a 30-minute drive of your stores and save the results in a table that shows the drive-time to the nearest store for each of those customers.
 |
TIP: If you have a web service license, you can create distance and time tables using real-time information. See Using Network Web Services for more information. |
 To Create Distance or Travel Time Tables
- Open a map that contains either a layer with origin and destination selection sets or two layers.
- Choose Tools>Routing & Directions>Distance and Travel Time Tables or click
 Distance and Travel Time Tables in the analysis tools drop-down on the Standard toolbar to display the Distance and Travel Time Tables dialog box.
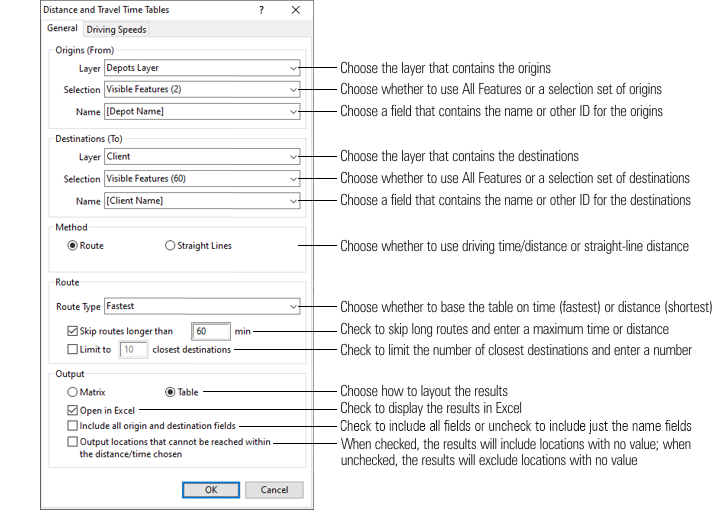
- In the Origins (From) frame, choose the layer that contains the origins from the Layer drop-down list, choose whether to use all features, only features that are visible in the map, or a selection set from the Selection drop-down list, and choose a field that contains the name or other ID of the origins from the Name drop-down list.
- In the Destinations (To) frame, choose the layer that contains the destinations from the Layer drop-down list, choose whether to use all features, only features that are visible in the map, or a selection set from the Selection drop-down list, and choose a field that contains the name or other ID of the destinations from the Name drop-down list.
- Choose whether to use driving time/distance or straight-line distance from the Method radio list. If no line layer is present in the map, only the Straight Lines option will be available.
- If you chose the route method, then make choices as follows:
| To do this... | Do this... |
|---|---|
| Choose to base the table on fastest time | Choose Fastest from the Route Type drop-down list. |
| Choose to base the table on shortest distance | Choose Shortest from the Route Type drop-down list. |
| Omit very long routes from the table | Check the Skip routes longer than box and enter a maximum time or distance in the box. |
| Limit the number of destinations to the closest | Check the Limit to box and enter a number of destinations |
- Choose output options as follows:
| To do this... | Do this... |
|---|---|
| Choose how to layout the results | Choose Matrix or Table from the radio list |
| Display the results in Excel | Check the Open in Excel box |
| Choose which fields to include in the table | Check the Include all origin and destination fields box to include all fields or leave unchecked to include just the name fields |
| Choose how to handle long routes that were skipped | Check the Output locations that cannot be reached within box to include those locations in the table with no values or leave unchecked to exclude locations with no value |
- To adjust speeds for the street layer, click the Driving Speeds tab and choose the Factors option in the radio list to use the sliders to make the speeds faster or slower for the different road classes or choose the Target Speeds option in the radio list to enter target speeds for some different road classes. The sliders correspond to speeds factors 1/5, 1/3, 1/2, 1, 1.176, 1.538, and 2. Driving speeds can only be adjusted when using the 2016 or later version of the HERE street file.
- Click OK. If you chose to create an Excel file, Maptitude launches Excel and displays the results. If you chose to create a table, Maptitude prompts you for a file name. Enter a file name and click Save. If you chose to create a matrix, Maptitude prompts you for a file name for the distance matrix and the time matrix. Enter a file name for each and click Save. Maptitude displays the resulting table(s) in a new dataview.
If you chose the fastest route, the distances reported are for traveling along the fastest route. If you chose to optimize on distance, the times reported are for traveling along the shortest route.
Try It Yourself: Creating Distance and Travel Time Tables
1. Choose File>New Workspace or click  on the Standard toolbar, choose New map of {country name}, then use Create-a-Map Wizard to create a map of the city where you live. You are going to add some points to the map and create a matrix of the travel time and distance between the point features.
2. Choose Tools>Analysis>Buffers Toolbar or click  Buffers Toolbar in the analysis tools drop-down on the Standard toolbar to display the Buffers toolbar.
3. Click  on the Buffers toolbar and click on 5-10 locations where you want to add points.
4. Click  to add the points as a layer in the map.
5. In the Display Manager, click the label symbol next to the new layer, choose ID from the Field drop-down list, and click OK. Maptitude labels the points with their IDs.
6. Choose Tools>Routing & Directions>Distance and Travel Time Tables or click Distance and Travel Time Tables in the analysis tools drop-down on the Standard toolbar to display the Distance and Travel Time Tables dialog box.
7. Verify that Point is chosen in the Layer drop-down list for both the origins and destinations, choose Matrix from the Output radio list, and check the Open in Excel box.
8. Click OK.
9. Type “My Travel Matrix” as the file name and click Save. Maptitude displays the results in Excel. One tab shows the travel times and the other shows the distances. Close Excel when you are done looking at the results.
10. Choose File>Close Workspace and click Don't Save to close the workspace without saving any changes.
©2026 Caliper Corporation