What kinds of Comparison Analysis can I do for two groups of locations?
Steps for performing a variety of different analyses to compare two groups of locations
Maptitude Learning Portal articles tagged with Color Theme
Steps for performing a variety of different analyses to compare two groups of locations
Help on when you can use the Update Linked Records feature in Mapitude
How to use the color and size theme options to create a Glow map on an area layer
How to create and save a color theme with custom icons, then reapply and edit the same theme
How to customize the color scheme for Density Grids
How to make a color theme appear slightly transparent so you can see features underneath
Changing the default colors used in every color theme
How to use the household income by age of householder data in Maptitude
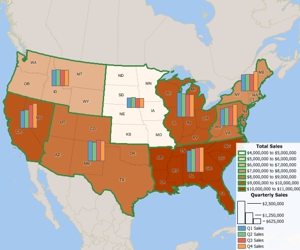
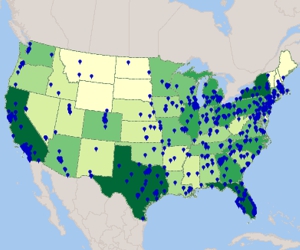
Using the MapWizard® tools to create color/heat themes, chart themes, dot-density themes, 3D themes, and scaled-symbol size themes, pattern and multiple symbol themes, and bubble theme maps.
Using Maptitude Create-a-Map Wizard™ to show your data joined to postal codes and to geocode (pin map) your data by street address