Maptitude Help / Geographic Analysis Tools / Creating Density Grids
Creating Density Grids/Heat Layers
Density/heat layers are a way to visualize and analyze point data by transforming the points into a regular grid. Each resulting grid cell is assigned a value that is determined by the density of nearby points, optionally weighting each point using a weighting value.
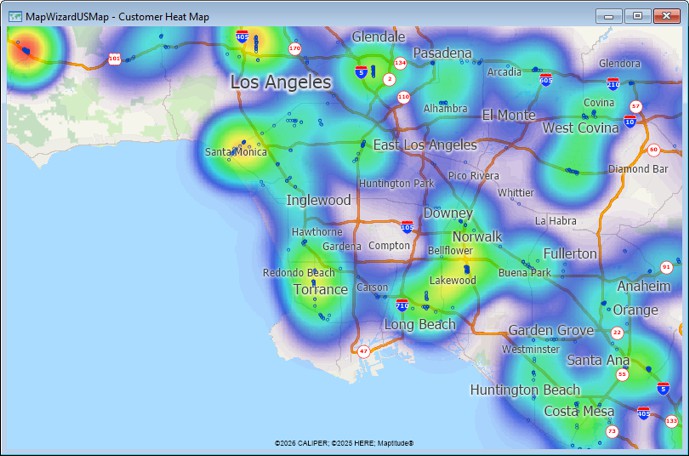
Density/heat layers are useful for:
- Mapping crimes to show hot spots
- Mapping vehicle miles traveled to show hot spots for congestion and air pollution
- Showing the distribution of real estate sales, weighted by the sale price
- Analyzing the pattern of clients around a store, weighted by the cost of their purchases
You can choose from among four methods for creating the layer. Three methods calculate a value for each grid cell by factoring values for the points within the search radius:
- Quartic is the default method, and uses a quartic approximation of a normal (Gaussian) distribution to apply smoothing factors to the values, and provides the most smoothing; this is sometimes called kernel density
- Triangular uses a conical distribution to apply smoothing factors to the values, and provides some smoothing
- Uniform uses a flat distribution to apply smoothing factors to the values, and provides little smoothing; this is sometimes called simple density
The fourth method, Count, only assigns points to the cell that they lie in and does not factor in values for any neighboring cells.
You can create the density/heat layer based on all the features in a layer, a selection set, or the visible features in the map. In each case, the grid will be slightly larger than the extent of the features used to create the grid, so that the density can be computed more accurately.
The search radius and the grid cell width are expressed in the current map units for a projection, or the display units for a coordinate system. The grid cell width is chosen to create the density grid quickly and with a reasonable resolution. You can use a finer grid, but it will take longer to create.
The quality of the density grid is directly related to the choice of the search radius. If the search radius is too large, important point concentrations will be missed, as they are smoothed over a large search area. The default search radius is the larger of:
- The width or height of the layer or the selection set, whichever is smaller, divided by the square root of the number of source points
- Twice the grid cell width
Maptitude saves the results in a compact (.cdf) area geographic file. You can automatically create a color theme for the density grid, to show the variations in the density surface.
 |
For a video tutorial see: (Internet connection required) |
 To Create a Density Grid/Heat Layer
- Open or create a map with at least one point layer and, if necessary, create a selection set for the point layer you will use.
- Choose a point layer from the drop-down list on the Standard toolbar.
- Choose Tools>Analysis>Density/Heat Layer or click
 Density/Heat Layer in the analysis tools drop-down on the Standard toolbar to display the Density/Heat Layer dialog box.
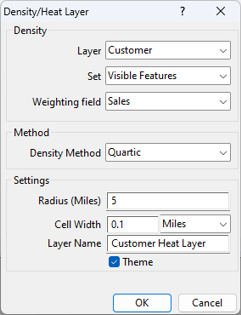
- Choose the point layer to use from the Layer drop-down list and choose whether to use all features, visible features, or a selection set from the Set drop-down list.
- Choose a field from the Weighting field drop-down list to weight the values of the points or choose None for no weighting.
- Choose a method from the Density Method drop-down list.
- Change the search radius and grid cell width if desired.
- Enter a name for the density/heat layer in the Layer Name box.
- Check the Theme box to display a color theme heat map on the grid.
- Click OK.
Maptitude creates the density grid and adds it as a map layer.
Try It Yourself: Creating a Density Grid
1. Choose File>New Workspace, choose New map of my data/table/spreadsheet from the first scroll list, and click OK.
2. In the Tutorial folder, open the Excel spreadsheet with logistics data for your country (e.g., Logistics Australia.xlsx, Logistics United States.xlsx, etc.).
3. Choose the Clients sheet and click OK. Maptitude displays Create-a-Map Wizard.
4. Click Next>, choose the first "Locate" option in the scroll list, and click Finish. Maptitude locates 60 clients and displays the locate results.
5. Click OK to display the map with the located clients. You want to create a density grid based on the clients and weighted by how many units each client purchases.
6. Choose Tools>Analysis>Density/Heat Layer or click Density/Heat Layer in the analysis tools drop-down on the Standard toolbar to display the Density/Heat Layer dialog box.
7. Verify that Clients Layer is chosen in the Layer drop-down list, choose All Features from the Set drop-down list, and choose [Number of Units] from the Weighting Field drop-down list.
8. Click OK. Maptitude creates the density grid and theme, and adds it to the map.
9. Click  in the Display Manager next to Clients Layer to no longer display the clients on the map.
10. Choose File>Close Workspace and click Don't Save to close the workspace without saving any changes.
©2026 Caliper Corporation