Maptitude Help / Surface Analysis Tools / Digital Elevation Models
Digital Elevation Models (DEM)
A Digital Elevation Model (DEM) is a specialized database that represents the relief of a surface between points of known elevation. Similar to other geographic data sets, DEMs are referenced to a known coordinate system. The coordinate values are stored as degrees of longitude and latitude.
Creation of a DEM begins with the capture of an irregular array of elevations. These points, commonly referred to as the “original observations,” are used as input to an interpolation routine that will approximate the nature of the terrain between sample points.
Original elevation observations may be derived from any one or a combination of sources such as ground surveys, photogrammetric data capture, and cartographic data sources. For example, The United States Geological Survey (USGS) provides topographic data for the US as a series of rectangular grid DEM products that are derived from photogrammetric data sources and USGS topographic maps. The process of interpolation typically results in the creation of one of two commonly used DEM data structures: a rectangular grid of elevations, or a triangulated irregular network (TIN).
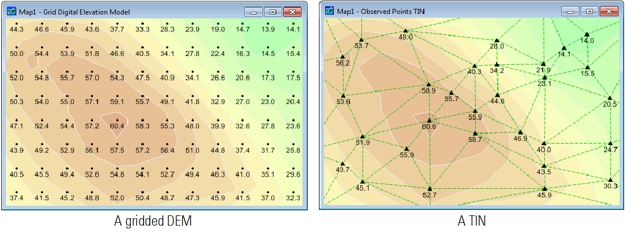
Rectangular grids provide a simple data structure in which data values are interpolated to create an evenly spaced grid across a geographic region. Rectangular grids can be stored in a grid geographic file and displayed as a grid layer.
TIN structures are based on triangular elements with vertices at sample elevations, and are derived through a form of interpolation that assumes that the surface between three points is a plane. The elevations for the points are stored in a point geographic file, and you can create a TIN from all or selected points in a point layer. Although TINs are a more complex data structure than rectangular grids, they are suited to the modeling of irregularities in a surface, and handling variations in the density of sample points.
Maptitude uses triangulation to interpolate terrains between sample data points (observations) and generate a TIN data structure. The TIN can be used as an input to a variety of terrain visualization and analysis functions, including elevation calculation, visibility analysis, and contour generation. You can also create a grid geographic file from a TIN.
Grid Layers
A grid layer stores a set of values for a regular array of cells; the cells are usually square. Grid layers are another type of map layer that Maptitude can use, in addition to point layers, for terrain analysis and 3D maps. Grid layers allow you to store any regular array of values. A common type of grid layer is a digital elevation model with regularly-spaced heights for a terrain.
A grid layer is stored in a grid geographic file. A grid geographic file stores just a value for each cell in the grid. The coordinates of the corners of the grid cells do not need to be stored, because they can be computed from the origin of the grid and the height and width of each cell, which are also stored in the grid geographic file.
The grid is assumed to be aligned with the projection or coordinate system. If you have gridded data that are at an angle to the projection or coordinate system, you will need to use other software to rotate the grid into alignment before using the grid with Maptitude.
A grid geographic file is much smaller and draws much faster than a point geographic file. However, point geographic files are necessary for storing scattered rather than regular spot values. Maptitude allows you to use either a grid layer or a point layer when you do terrain analysis or create a 3D map.
©2026 Caliper Corporation