Maptitude Help / Geographic Analysis Tools / Locating Weighted Centers
Locating Weighted Centers and Service Areas
The Tools>Analysis>Weighted Center command determines from a set of points, such as customers, a circular service area that encompasses all of the points and its center. Optionally, the center can be placed at the average of the coordinates of the set of points or can be weighted by any field in your point layer. The results can be either freehand items or geographic layers.
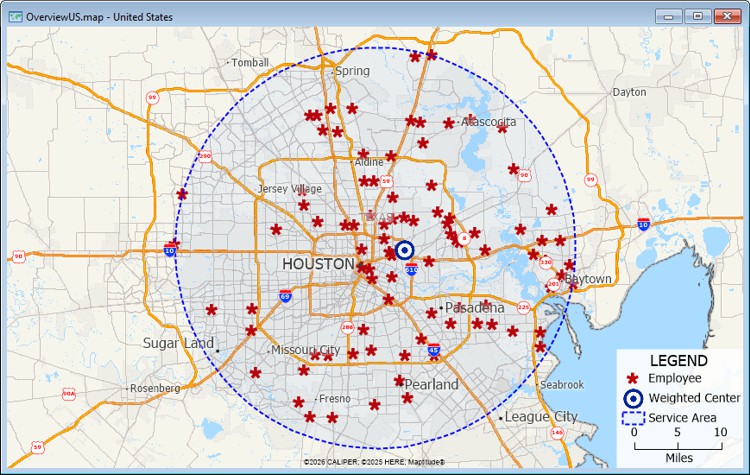
The circular service area encompasses all of the points and the center is weighted by the coordinates of the points
 To Locate a Weighted Center and Service Area
- Choose the point layer from the drop-down list on the Standard toolbar.
- Choose Tools>Analysis>Weighted Center or click
 Weighted Center in the analysis tools drop-down on the Standard toolbar to display the Weighted Center dialog box.
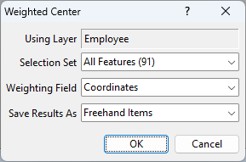
- Choose whether to use all features, visible features, or a selection set from the Selection Set drop-down list.
- Choose whether to weight the center by coordinates, a field in the point layer, or none from the Weighting Field drop-down list.
- Choose whether to display the results as freehand items on the map or as new layers from the Save Results As drop-down list.
- Click OK.
Maptitude adds the two new layers or the freehand items to the map.
 |
TIP: You can export demographic overlay data and other information to Excel by making the resulting service area layer the working layer and clicking |
 on the Standard toolbar or by right-clicking on the resulting freehand area and choosing Export to Excel.
Try It Yourself: Locating a Weighted Center and Service Area
1. Choose File>New Workspace, choose New map of my data/table/spreadsheet from the first scroll list, and click OK.
2. In the Tutorial folder, open the Excel spreadsheet with logistics data for your country (e.g., Logistics Australia.xlsx, Logistics United States.xlsx, etc.).
3. Choose the Clients sheet and click OK. Maptitude displays Create-a-Map Wizard.
4. Click Next>, choose the first "Locate" option in the scroll list, and click Finish. Maptitude locates 60 clients and displays the locate results.
5. Click OK to display the map with the located clients. You want to see the service area and weighted center of the clients based on how many units each client purchases.
6. Choose Tools>Analysis>Weighted Center or click Weighted Center in the analysis tools drop-down on the Standard toolbar to display the Weighted Center dialog box.
7. Choose All Features from the Selection Set drop-down list, [Number of Units] from the Weighting Field drop-down list, and Layers from the Save Results As drop-down list.
8. Click OK. Maptitude adds a circle that encompasses the trade area and a symbol at the weighted center. If the entire circle is not visible, right-click on Service Area in the Display Manager and choose Zoom.
9. Choose File>Close Workspace and click Don't Save to close the workspace without saving any changes.
©2026 Caliper Corporation