Last updated on May 11, 2026
Working with Tabular Data
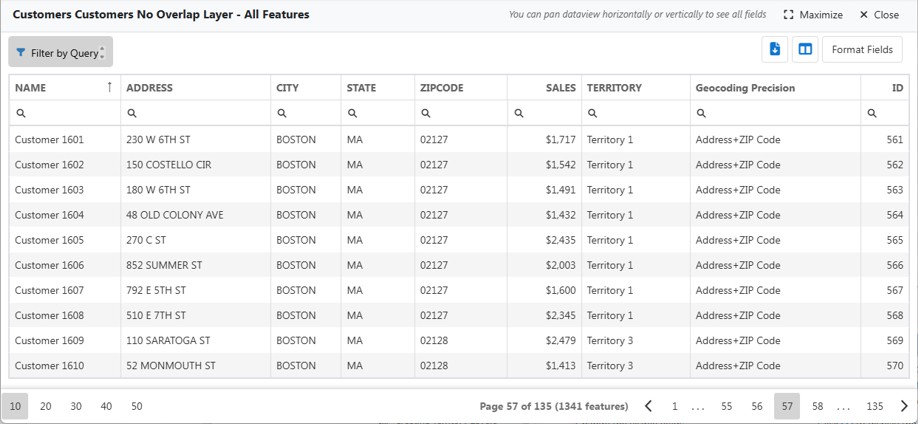
You can display data for layers in tabular form in a dataview. A dataview displays data as a table, with information presented in rows and columns. Each row is called a record and represents one person, place, or thing. Each column is called a field and contains one piece of information about each record. At the top of each column is a heading that contains the name of the field. You can control what fields are shown, sort fields, and filter the fields.
- Choose
 Layers on the sidebar.
 - Click + to expand portions of the legend.
- Make sure the Select
 tool is inactive.
 - Click
 . Maptitude Online displays data for the chosen layer in a tabular dataview in the lower half of the map window.
- Make choices about how to display the data as follows:
To do this... Do this... Sort the records Click a field heading to sort the records in increasing order based on the values for that field. Click the Field heading again to sort the records in decreasing order. An up or down arrow will display in the field heading indicating how the records are sorted. Change the visible fields Click  to display the Column Chooser. Check the boxes next to the fields that you want visible and uncheck the box next to fields you want to hide. Click
  in the Column Chooser when you are done.
Change the format of numeric fields Click  to display the Edit Fields Format dialog. Choose a format using the drop-down next to any of the numeric fields, and click OK.
Maximize the dataview Click Maximize. Click Restore to return to a split view with the map. Zoom the map to a feature Double-click on a row in the dataview Jump to a different page Click < or > or click one of the page links on the lower right. Export the data to an Excel file Click 
Close the dataview Click Close.
Filtering Data
You can filter features in a dataview or in a map to find records based on values in one or more fields. You can save up to three filtered sets and display those sets on a map. You can also manually filter features by directly clicking on features in a map.
Once you have filtered features into a set, you have the option of analyzing just the selected features.
Filtering data in a Dataview
When you are working with a dataview, you can filter it based on the values in one or more fields. Once you have filtered features, you can export them to an Excel file or save them to a selection set that can be highlighted on a map.
- Click Filter Table to display the Filter Builder.
- Click +.
- Click on the first drop-down and choose a field to use, click on the second drop-down to choose an operator, and enter a value. Click + again to add any additional conditions.
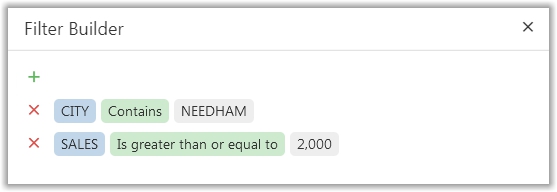
- Click OK. The dataview displays only records with data that conform to the filter(s) you specified and the Filter Table button will be replaced with the filter condition:
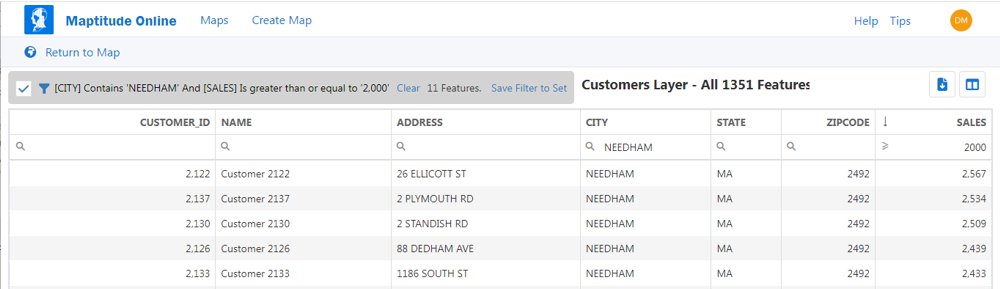
- Make choices as follows for the filtered features:
To do this... Do this... Toggle the filtered features and all of the features Uncheck the box to display all features and check the box to display the filtered features. Modify the filter Click  , modify the filter, and click OK.
Download the filtered features to an Excel file Click .Save the filtered features to a set Click Save Filter to Set, choose a set from the drop-down list in the Save Filter to Set pop-up (If you want, you can also rename the set in the drop-down list by clicking  and entering a new name), and click OK. Maptitude Online changes to the map view zoomed to show the filtered feature set. See Working with Selected Features in a Map for information on using the selected features in the map.
Delete the filter Click Clear.
Filtering Data in a Map
When you are working with a map, you can filter what features are shown on the map based on the values in a field. If you want to filter by more than one field, you should instead filter from a dataview. When you apply a filter to a layer in a map, just the filtered features will be displayed in the map. For example:
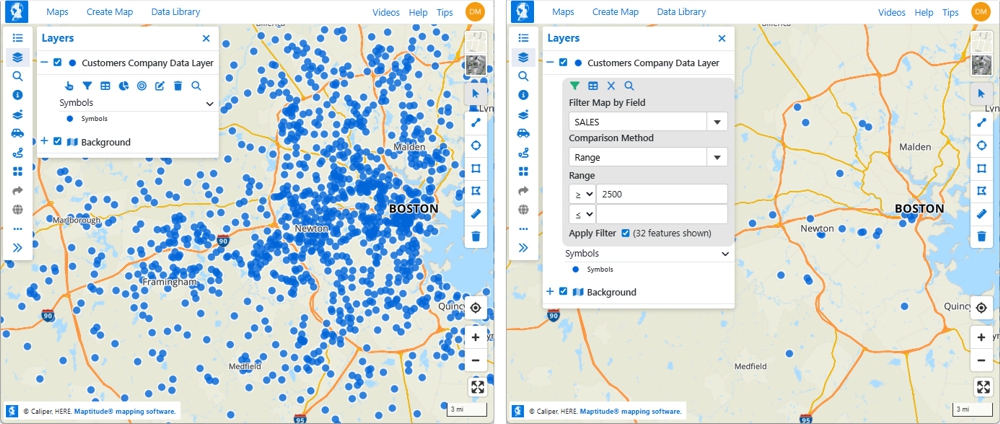
A map of customer where every customer is visible on the map (left) and the same map filtered to show only customers with sales greater than or equal to $2,500 (right)
To Filter the Features Shown in a Map
- Choose Layers on the sidebar.
- Click + to expand portions of the legend.
- Click
 . Choose a field from the Filter Map by Field drop-down.
 - Make choices as follows:
To do this... Do this... Filter a field that contains numeric values based on a range of values in that field Choose "Range" from the Comparison Method drop-down and enter values in one or both of the Range boxes Filter a field that contains numeric values for specific values Choose "Values" from the Comparison Method drop-down, click the Values box, and choose a value from the scroll list. The scroll list will contain all of the values in the field. You can type some numbers to filter the list to those containing the numbers you entered. Repeat this step to add more values to the filter. Filter a field that contains non-numeric values Click the Values box and choose a value from the scroll list. The scroll list will contain all of the values in the field. You can type some characters to filter the list to those containing the characters you entered. Repeat this step to add more values to the filter. - Check the Apply Filter box to see only the filtered features on the map or uncheck it to see all features.
- If you want to see a dataview of the filtered features, click . If you want to zoom the map to the selected features click
 . If you want to clear the filter, click
  .
.
Selecting Features on a Map
You can manually select features directly in a map using the Selection tool.
To Select Features with the Selection Tool
- Choose Layers on the sidebar.
- Click + to expand portions of the legend.
- Click to activate the Selection tool.
- Choose one of the selection sets from the drop-down list. By default, the selection filters are named "Selection," "Selection 2," and "Selection 3." You can click in the drop-down list to change the default names.
- Click on individual features on the map or click and drag over several features to select them. You can right-click on features to deselect them. The number of features selected is displayed in the drop-down list.
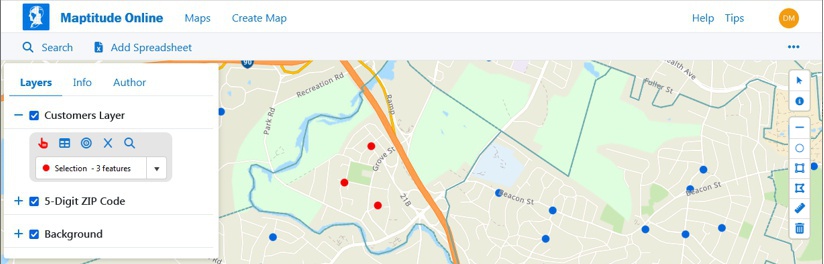

TIP: At small scales the Selection tool will select several features that are clustered close together. You may want to zoom in on areas with densely clustered features to select features with more precision.
Working with Selected Features in a Map
Once you have a map with one or more selection sets of features, you can:
- Zoom the map to show the extent of the selected features
- Open a dataview of the selected features
- Perform analysis functions such as creating buffers or areas of influence around the selected features
- Clear the items in the selection set
To Use Selected Features in a Map
- Choose Layers on the sidebar.
- Click + to expand portions of the legend.
- Choose the set with which you want to work from the drop-down list.
- Make choices as follows:
To do this... Do this... View tabular data for the selected features Click . Build buffers around, find a weighted center, or create areas of influence around the selected features Click  to start Create-a-Map Wizard, choose a type of analysis and other settings, then click Next. Enter a map name and click Finish. See Types of Analysis for more information.
Zoom the map to show all of the selected features Click .Clear the selection Click and click Clear to confirm. - Click
 to close the Layers pane and see more of the map.
|
|
TIP: You can also create buffers, areas of influence, and weighted centers for all of the features in a layer instead of all of just the selected features. See To Perform Analysis on a Point Layer on the Map for more information. |
©Copyright Caliper Corporation www.caliper.com • 1172 Beacon St., Suite 300, Newton MA 02461 USA