Last updated on July 20, 2026
Creating a New Map
There are two types of maps that you can create with Maptitude Online.
- Create a new map that utilizes your own data from a table or spreadsheet and displays it either as points on a map or attached to a geographic layer
- Create a new map showing specific boundaries (ZIP Codes, Counties, States, etc.) and optionally display Census demographic data with a theme of your choice
Creating a Map Using Your Own Data
You can use data stored in Excel or CSV files, Google Sheets, or Salesforce objects to create a new map or to add to an open map or you can copy data into the spreadsheet.
 |
For a tutorial video see: Mapping Your Data with Maptitude Online SaaS |
There are two basic ways that you can map your own data:
- Locate records in your file as points on a map: Create-a-Map Wizard has several locate options that will create a pin map showing the locations of your customers, stores, or other facilities. If your data include address information, and you want the maximum precision, you can locate your records to their precise street address. Otherwise you can pin map your data to a postal code or a city for slightly less precision.
- Show area boundaries with your data attached: Create-a-Map Wizard has several options for attaching your data to area layers. Use these options to create a color theme map showing the total sales in each postal code or the number of customers in each state.
For example, given the following Excel file of customer data that contains address and sales data:
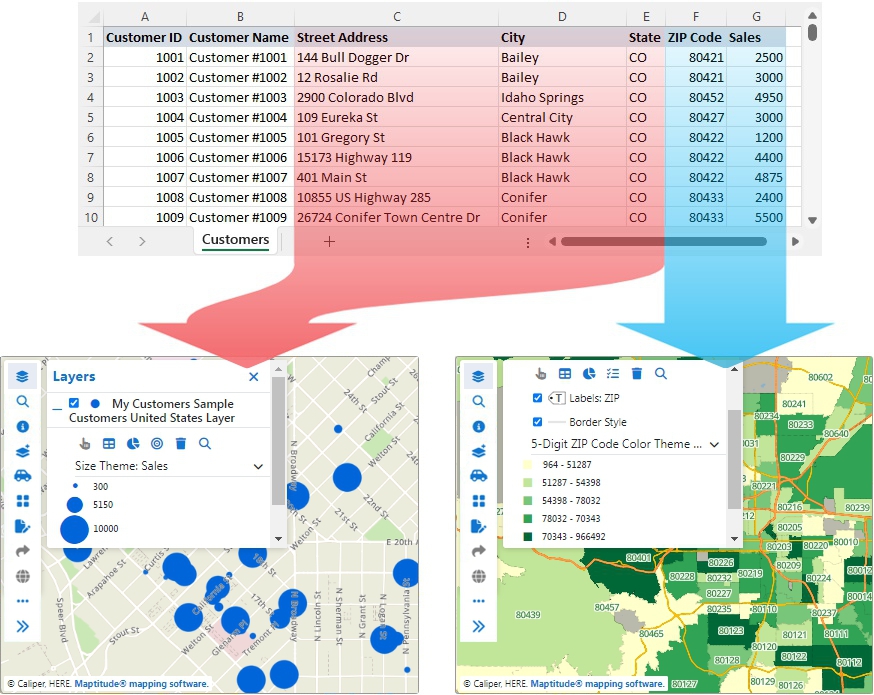
...you can use the address data to locate the records as points on a map (left) or group the records by postal code to see the total sales for each postal code (right)
When you create a new map, you have the option of showing your data with themes. Maptitude Online supports many types of themes for illustrating the geographic patterns in your data. The types of themes that you can create depend on the type of layer that you are using and the type of data. For more information on themes, see Types of Themes.
When you create a map that locates records in your file as points on a map, you have the option of performing several types of analysis on the features. For more information on analyzing point features, see Types of Analysis.
To Create a New Map Using Your Data
- Click the Create Map tab.
- Choose the data source as follows:
To use... Do this... An Excel or CSV file - Choose My data/table/spreadsheet from the radio list.
- Drag an Excel or CSV file to the Drop file or click here to upload box or click the click here link and choose an Excel or CSV file that contains the data to be mapped.
- If you uploaded an Excel file that contains more than one worksheet, choose the sheet that contains the data to be mapped.
A Google sheet - Choose Google Sheets from the radio list.
- If you are not already connected to your Google account, click the link to go to the Settings page and click Connect Google Sheets in the Integrations section of the page. Login to your account and return to the Create Map tab and choose Google Sheets again from the radio list.
- Click Browse Spreadsheets, choose one of your spreadsheets, and click Select. The available sheets withing the file you chose will be listed below the radio list.
- Click on the sheet you want to map.
A Salesforce object - Choose Salesforce Data from the radio list.
- If you are not already connected to your Salesforce account, click the link to go to the Settings page and click Connect Salesforce in the Integrations section of the page. Login to your account and return to the Create Map tab.
- Select the object to import by clicking one of the respective buttons.
- Click Next and follow the Create-a-Map Wizard prompts to specify the type of map, theme, analysis, and to name the map.
- On the Address Fields tab verify the fields that Maptitude Online found in the file that can be used for mapping.
- On the Type of Map tab choose how to map your data. The options listed will depend upon the fields in your data. Choose one of the "Locate" options to geocode (pin map) each record in your data as a point feature on the map or choose to "show" your data aggregated to an area layer in the map.
- On the Choose Theme tab choose whether to show a theme using your data. The options will depend upon the type of map that you chose in the previous tab. Choose what fields to use for the theme and choose a field to use to label the features. For more information on themes, see Types of Themes.
- On the Choose Analysis tab choose a type of analysis. This option is only available if you chose to geocode your data. For more information, see Types of Analysis. Make choices as follows:
To do this... Do this... Locate the features with no additional analysis Choose None Build buffers around all of the features Choose Buffers from the radio list, specify the buffer sizes and units, choose whether to create merged or separate buffers, and choose whether to calculate a population overlay for the buffers. See Buffers for more information. Build areas of influence around all of the features Choose Areas of Influence from the radio list and choose whether to calculate a population overlay for the areas. See Areas of Influence for more information. Find the weighted center of all of the features Choose Weighted Center from the radio list and choose a weighting field from the list. See Weighted Center for more information. - On the Map Name tab: Enter a name for the map
- Click Finish.
Maptitude Online creates the map, switches to the Maps tab, and adds the map as a new card that you can now view.
|
|
TIP: You can also create buffers, areas of influence, and weighted centers for a filtered set of features instead of all of the features in a layer. See Working with Selected Features in a Map for more information on working with filtered sets. |
Creating a Map Showing Specific Boundaries
You can create a map that examines the demographics for any location in the United States. You choose the geographic level (e.g., ZIP Code, County, State), the Census data fields of interest, and how to display the data thematically for any location you choose.
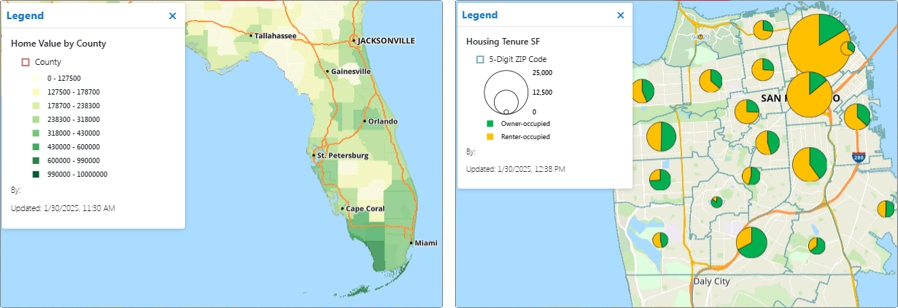
For example, you could choose to map counties and create a map that contains a color theme illustrating the median home value in every county in Florida (below left) or you could choose to map 5-digit ZIP Codes and create a map that shows a chart theme illustrating the share of owner-occupied and renter-occupied housing in every ZIP Code in San Francisco (below right).
To Create a New Map Showing Specific Boundaries
- Click the Create Map tab.
- Choose Boundaries (ZIP Codes, States, etc.) with or without Demographics from the radio list.
- Click Next and follow the Create-a-Map Wizard prompts:
- On the Choose Layer tab, choose the layer that you want to show in the map, and click Next.
- On the Choose Fields tab, choose up to 12 of the available demographic fields by checking the box next to a field in the scroll list. All of the available fields will be listed in the scroll list. You can choose to filter the fields by category from the drop-down list or enter a few characters in the Filter box to find fields that contain the characters that you enter. Click Next when you are done.
- On the Choose Theme tab, choose whether to show a theme using one or more of the demographic fields that you chose in the previous step (see Types of Themes for more information). To label the map features, choose a field to use for the labels from the Display Labels drop-down list. Click Next when you are done.
- On the Zoom To tab, specify a location to display when the map is first created and click Next.
- On the Map Name tab, enter a name for the map.
- Click Finish.
Maptitude Online creates the map, switches to the Maps tab, and adds the map as a new card that you can now view.
To Modify the Fields in a Layer
- Open a map that contains one of the standard boundary layers.
- Choose
 Layers on the sidebar.
 - Click + next to the layer of interest and click
 .
. - Check the boxes next to any additional fields you want to include in the map or click X next to fields you want to drop.
- Click Finish.
©Copyright Caliper Corporation www.caliper.com • 1172 Beacon St., Suite 300, Newton MA 02461 USA