Last updated on May 18, 2026
Viewing Maptitude Online Maps
You open a Maptitude Online map by clicking on the map card.
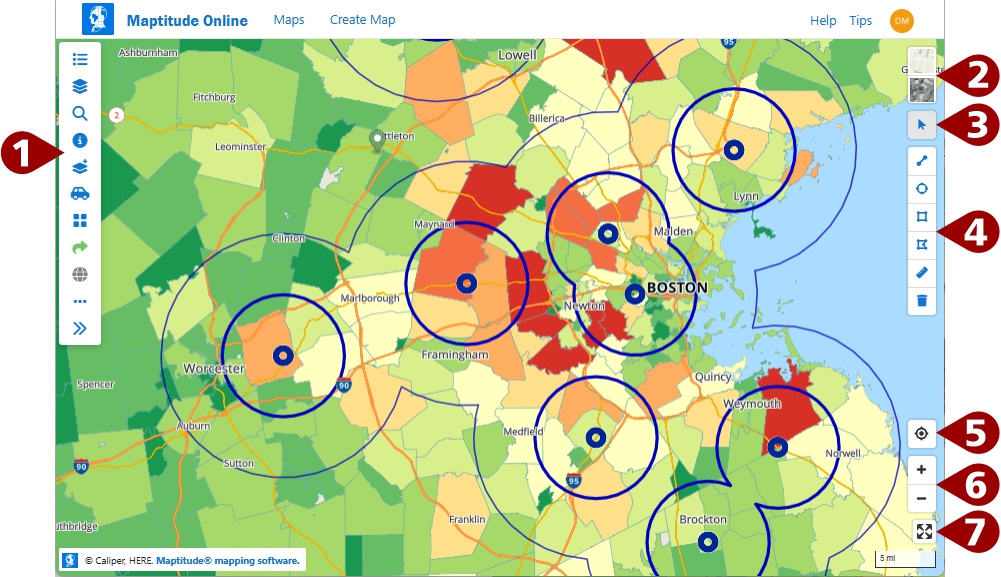
When you open a map, it will contain the following components:
| 1 | A Sidebar that contains the tools for working with maps. Click |
| 2 | Background tools for toggling between a basemap and satellite background |
| 3 | A Pointer tool |
| 4 | Drawing tools |
| 5 | A  tool to zoom to your location if your security settings permit tool to zoom to your location if your security settings permit |
| 6 | Navigation tools for zooming in and out |
| 7 | A |
You use sidebar, navigation tools, background tools, and drawing tools to:
 Display a map legend
 Control what is visible in the map
 Change the style or label of map features
 Change the map scale and location
 Display information about map features
 Add drive-time rings to the map
 Create territories
 Share and Publish Maps
 Draw items on the map
 Display reports
 Manage maps
|
For a tutorial video see: Maptitude Online Mapping Software Basics |
Displaying the Map Legend
The legend displays information about the map, the author, and any team members with whom the map is shared.
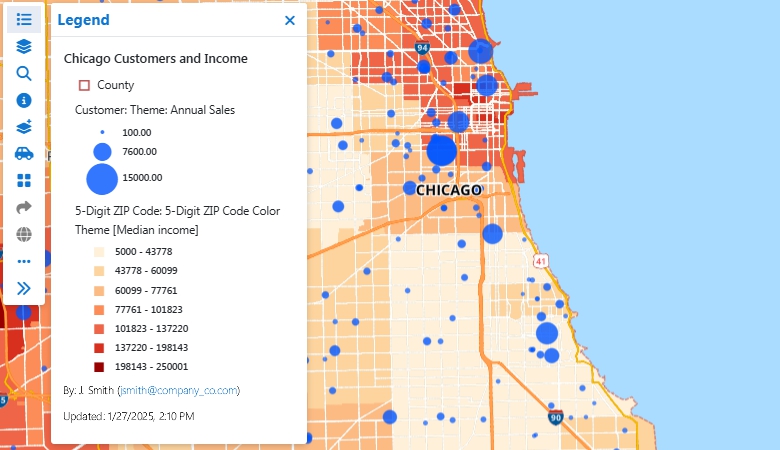
To Display the Legend
- Choose
 Legend on the sidebar.
 - Click
 to close the Legend pane and see more of the map.
To Export the Legend to an Image File
- Choose Options on the sidebar and click
 Export Legend Image.
Maptitude Online downloads a PNG image file of the legend.
Changing the Map Scale and Location
Maptitude Online offers a number of different ways for you to display a location of interest including manually zooming and panning, setting the map scale so that all features in a layer are visible, zooming to your location, or searching for a specific location of interest.
To Manually Move Around a Map
- Use the navigation tools to zoom in and out as follows:
To do this... Do this... Zoom in Click the + Navigation tool or scroll your mouse wheel away from you. If you are using a phone or tablet, double-tap or pinch-zoom-in. Zoom out Click the – Navigation tool or scroll your mouse wheel toward you. If you are using a phone or tablet, pinch-zoom-out. - Pan the map by clicking and dragging on the map. Release the mouse button to stop panning the map. If you are using a phone or tablet, touch and drag.

TIP: You can also use the keyboard to zoom, pan, and rotate a map. Right-click on the map and then use the + key to zoom in, - key to zoom out, arrow keys to pan, Shift+ left/right arrow keys to rotate a map, and Shift+ up/down arrow keys to make the map oblique

NOTE: You cannot pan the map when the Selection
 tool is active nor when the Circle
  drawing tool is active.
To Zoom to Your Location
- Click to zoom to your location if your security settings permit. A blue dot shows you location on the map with a light blue circle around it. Your location will be within the light blue circle. It will continue to track your location as long as it is enabled.
- Click again to hide the dot and circle and stop tracking your location.
To Zoom to a Particular Location
- Choose
 Search on the sidebar.
 - Enter an address, city and state abbreviation, postal code, state name or abbreviation, or landmark. Free-form queries are processed first left-to-right and then right-to-left if that fails. So you may search for "Beacon St., Newton MA" as well as for "Newton MA, Beacon St." Commas are optional, but improve performance by reducing the complexity of the search.
- Click Search.
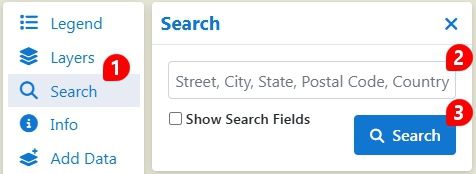
- If you cannot find what you are looking for by using the free-form text entry you can check the Show Search Fields box and further specify a specific city, state, postal code, or country to search in.
- Click to close the Search pane and see more of the map.
The map will zoom to the address, city, postal code, state, or landmark that you entered.
To Show All of the Features in a Layer
- Choose
 Layers on the sidebar.
 - Click + next to the layer of interest.
- Click .
- Click to close the Layers pane and see more of the map.
The map will display at a scale such that all of the features in the chosen layer are visible on the map.
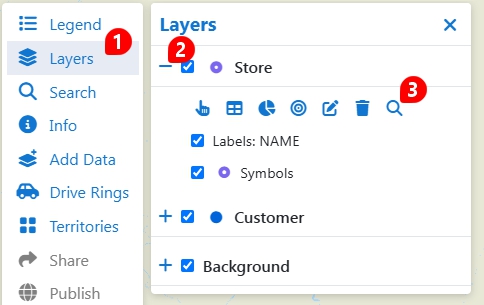
Controlling the Map Layers
- Choose Layers on the sidebar.
- Click + to expand portions of the sidebar. The layers in the map are listed and information about any themes is displayed.
- Make changes to the visible layers in the map as follows:
To do this... Do this... Rename a layer Click  , click the Name tab, edit the name in the Layer Name box, and click Finish.
Hide a layer, label, or theme Uncheck the box next to the item you want to hide. Show a layer, label, or theme Check the box next to the item you want to show. NOTE: At certain scales it may not be possible to turn on a layer or label. For example, when you zoom far out a map would be too cluttered to display streets and highways. When this is the case, the checkbox is replaced by a  symbol and you must change the map scale to show the layer or label.
Permanently remove a layer from the map Click  .
. - Expand the Background section to choose whether to hide or show any of the standard map layers. You can also choose whether to use a map background by clicking
 or a satellite image background by clicking
  .
. - Click to close the Layers pane and see more of the map.
Changing Styles and Labels
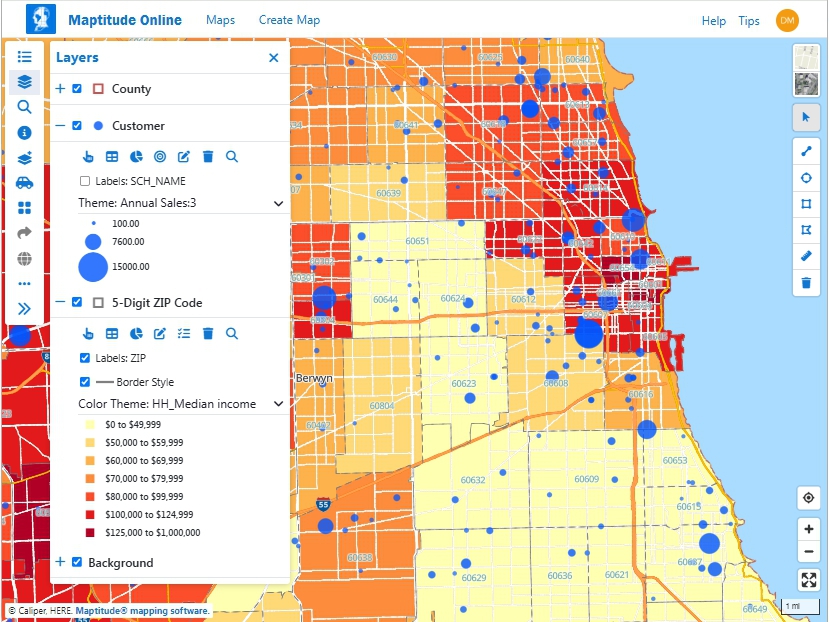
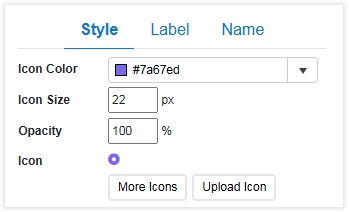
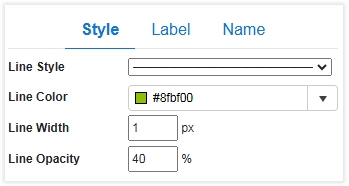
Maptitude Online uses the term style to talk about the colors, symbols, and lines that are used to draw map features. For your point layers, you can control the color and icon used, the size, or upload custom markers and branded images or logos (must be an image format such as BMP, ICO, JPG, PNG, SVG). For line layers, you can control the color, dash style, and width. For area layers you can control the boundary color, dash style, width, and fill.
Labels are used to identify the features in a layer by their names or other characteristics. To label features, you choose one or more data fields containing the information you want to see and the label size and color.
You can modify the style and labels of layers that you add to your maps. You cannot change the underlying background layer styles or labels.
To Change the Style of a Point Layer
- Choose Layers on the sidebar.
- Click the icon indicating the current style of the points or click + next to the layer of interest and click . Maptitude Online displays the Edit Style window with the Style tab active.
- Make changes as follows:
To do this... Do this... Change the color of the icon Click the Icon Color drop-down and choose a color. Change the size of the icon Use the up and down spinners in the Icon Size box or type a specific value in pixels. Change the opacity of the icon Use the up and down spinners in the Opacity box or type a specific percentage value. Change the icon Click More Icons, choose an icon, and click OK. Upload an image file to use Click Upload Icon, browse for an image file and, click Open. - Click OK.
To Change the Style of a Line Layer
- Choose Layers on the sidebar.
- Click the sample showing the current style of the lines or click + next to the layer of interest and click . Maptitude Online displays the Edit Style window with the Style tab active.
- Make changes as follows:
To do this... Do this... Change the line style Click the Line Style drop-down and choose a style. Change the color of the lines Click the Line Color drop-down and choose a color. Change the width of the lines Use the up and down spinners in the Line Width box or type a specific value in pixels. Change the opacity of the lines Use the up and down spinners in the Line Opacity box or type a specific percentage value. - Click OK.
To Change the Style of an Area Layer
- Choose Layers on the sidebar.
- Click the sample showing the current style of the areas or click + next to the layer of interest and click . Maptitude Online displays the Edit Style window with the Style tab active.
- Make changes as follows:
To do this... Do this... Change the border style Click the Border Style drop-down and choose a style. Change the border color Click the Border Color drop-down and choose a color. Change the border width Use the up and down spinners in the Border Width box or type a specific value in pixels. Change the opacity of the border Use the up and down spinners in the Border Opacity box or type a specific percentage value. Change the fill color Click the Fill Color drop-down and choose a color. Change the opacity of the fill Use the up and down spinners in the Fill Opacity box or type a specific percentage value. - Click OK.
- Choose Layers on the sidebar.
- Click the sample showing the current style of the areas or click + next to the layer of interest and click . Maptitude Online displays the Edit Style window with the Style tab active.
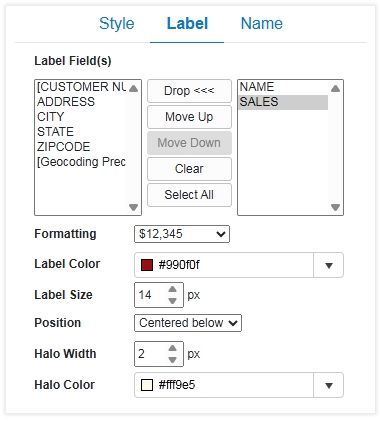
- Click the Label tab. Fields that can be used for the labels are shown in the left scroll list. Fields that will be used for the labels are shown in the right scroll list.
- Make changes as follows:
To do this... Do this... Choose a field to use for labeling features Choose fields from the left scroll list and click Add>>>. Remove labels Choose fields from the right scroll list and click Drop<<< or click Clear to remove all label fields. Change the label color Click the Label Color drop-down and choose a color. Change the label size Use the up and down spinners in the Label Size box or type a specific value in pixels. Change where the label is displayed Choose an option from the Position drop-down. Display a halo around the label Use the up and down spinners in the Halo Width box to choose a halo width and click the Halo Color drop-down and choose a color. Display a label without a halo Use the down spinner in the Halo Width box to set the width to zero (0) or type 0 in the box. Choose a format for numeric fields Choose a numeric field in the right scroll list and choose an option from the Formatting drop-down. Change the order of label fields
Choose a field in the right scroll list and click Move Up or Move Down.
- Click OK.
Using the Drawing Tools
You can use the drawing tools to add a line, circle, rectangle, or polygon to a map. When you draw features on a map they will be annotated with their dimensions and name. In addition, you can use the Pointer ![]() tool on circles, rectangles, or polygons that you draw to see the estimated demographics of the populations within those areas. To Show All of the Features in a Layer
tool on circles, rectangles, or polygons that you draw to see the estimated demographics of the populations within those areas. To Show All of the Features in a Layer
To Use the Drawing Tools
- Click on a drawing tool to activate it and use it as follows:
Tool How to use it Draw Line 
Click where you want the line to start, single-click to add intermediate points, or double-click to end the line. As you move the cursor, the length of the line will be displayed. Draw Circle Click and drag a circle. As you drag, the radius and area will be displayed. Alternatively, you can single-click on the map, enter a radius value, choose the units, and click OK. Draw Rectangle 
Click at one corner of where the rectangle should start. As you drag, the dimensions and area will be displayed. Click again when the rectangle is the desired size. Draw Polygon 
Click at one corner of where the polygon should start. As you drag, the dimensions of the polygon will be displayed. Click at additional locations and double-click to close the polygon. - Modify any of the drawing items that you add to a map as follows:
To do this... Do this... Move an item Click the Pointer  tool to activate it, click on a line or the border of an area item to highlight it, click
  and click and drag it to a new location.
Change the shape of a line or polygon, or resize a circle Click the Pointer tool to activate it, click on a line or the border of an area item to highlight it, click and drag any of the circular node handles to a new location.Change the name of an item Click the Pointer tool to activate it, click on a line or the border of an area item to highlight it, click  , enter a name, and click OK.
Change the measurement units Click the Pointer tool to activate it, click on a line or the border of an area item to highlight it, click , choose the units from the drop-down list, and click OK.Hide the dimensions of the drawn items Click  . Click
  to toggle the dimensions back on.
Delete an item Click the Pointer tool to activate it, click on a line or the border of an area item to highlight it, click , and click Yes to confirm.Delete all drawn items Click the drawing tool and click Yes to confirm.
If you drew a circle, polygon, or rectangle, you can use the Pointer tool to see the estimated demographics of the populations within those areas in the ![]() Info pane.
Info pane.
|
NOTE: Drawing items will not be displayed on publicly shared maps. |
Displaying Information About Individual Features on a Map
You use the Pointer tool to see information about features on a map or estimates of the demographics for areas that you draw on a map. You can also display tabular data for an entire layer. For more information, see Working with Tabular Data.To Add Drive-Time Rings to a Map
To Display Information About Map Features
- Click on the Pointer tool to activate it and then click (or tap if you are using a phone or tablet) on a feature on the map or on an area that you added with the drawing tools. A pin
 is added to the map and the Info pane will display information for any features near where you clicked. If features are in more than one layer, use the drop-down list to choose the layer for which you want to see data.
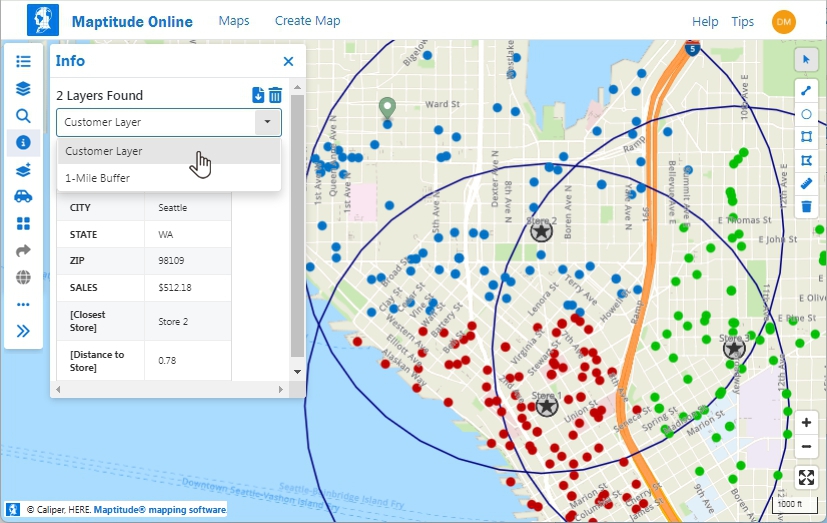
- Click
 if you want to download data for the features to an Excel file.
 - Click
 to remove the pin from the map and clear the Info pane.
Displaying Reports
If any PDF reports were uploaded with the map from desktop Maptitude, the Sidebar will include a ![]() Reports item.
Reports item.
To Display Reports
- Choose
 Reports on the Sidebar and choose a report. A PDF viewer displays the report.
 - Scroll through the report or use the download or print buttons. Close the PDF viewer when you are done.
Managing Maps
You can rename, save an image of, copy, or delete an open map by choosing ![]() Options on the sidebar.
Options on the sidebar.
To Manage an Open Map
- Choose Options on the sidebar and make choices as follows:
Choose this... To do this... Rename Display the rename pane where you can enter a new name and click Rename. Export Map Image Download a PNG file format image of the map. Export Legend Image Download a PNG file format image of the legend. Make a Copy of this Map Make a copy of the map. Enter a name for the map copy and click Continue. Maptitude Online closes the map, makes a duplicate, and displays the home desktop with a new map card for the copy. Delete To display a confirm message that you want to delete the map from Maptitude Online and click Delete.
©Copyright Caliper Corporation www.caliper.com • 1172 Beacon St., Suite 300, Newton MA 02461 USA