Maptitude Help / Geographic Analysis Tools / Creating Areas of Influence
Creating Areas of Influence
The map below shows the location of subway stations. The area that is closest to each station is called its area of influence (also called Thiessen Polygons or a Voronoi Diagram). Maptitude can automatically create straight-line areas of influence around any number of points in a layer.
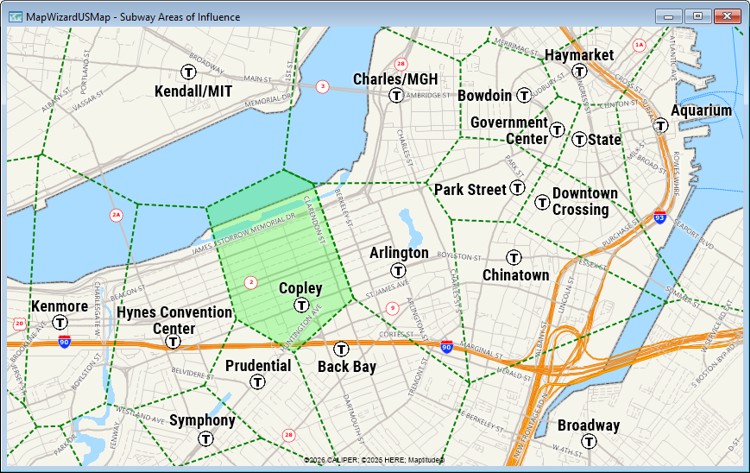
All of the area highlighted in green is closer to the Copley subway station than other stations.
To create straight-line areas of influence, you simply choose the set of point features you want to use. Maptitude creates the areas of influence, and saves them in a geographic file. When Maptitude creates straight-line areas of influence, it starts by building a large circle containing all the points of interest. Then it divides the circle into areas, with one area for every input point. As a result, the areas that are built around the points on the edge can be much larger than those in the middle.
As an option, Maptitude will use an overlay to estimate the attributes for each area based on data stored in some other layer in the map. If you use an overlay to estimate the attributes of areas of influence, remember that the ones around the edge are larger than the others.
You can also build areas of influence that are drive-time based, using the Tools>Routing & Directions>Drive-Time Influence Areas command. See Creating Drive-Time Influence Areas to learn more.
 |
For a video tutorial see: (Internet connection required) • Areas of Influence and Network Partitions: Creating catchment areas based on straight-line distance or drive-time |
 To Build Straight-Line Areas of Influence
- Choose the point layer you want to use from the drop-down list on the Standard toolbar.
- Choose Tools>Analysis>Straight Line Influence Areas or click
 Straight Line Influence Areas in the analysis tools drop-down on the Standard toolbar to display the Straight Line Influence Areas dialog box.
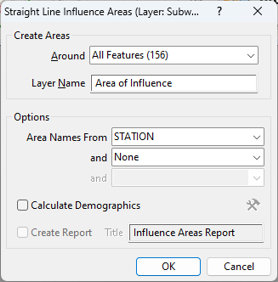
- Choose whether to create the areas of influence around all features, visible features, or a selection set from the Around drop-down list.
- Enter a name for the new area of influence layer in the Layer Name box.
- Choose up to three fields to identify the feature to which the areas belong from the drop-down lists.
- To calculate demographics for the areas of influence, check the Calculate Demographics box. Optionally, check the box to create a report of the demographics.
 |
TIP: Regardless of whether you choose to calculate demographics, you can export demographic overlay data and other information to Excel by making the resulting area of influence layer the working layer and clicking |
 on the Standard toolbar.
- If you checked the Calculate Demographics box, you can specify the attributes to calculate and/or count features in the buffers. Click
 to display the Demographic Settings dialog box and make choices as follows:
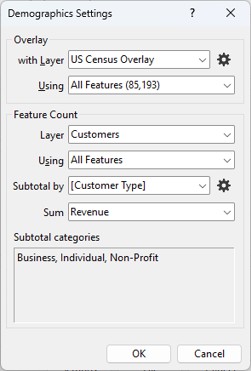
- Choose a reference layer with demographics and the features to use from the with Layer and Using drop-downs list. Typically Maptitude will choose an appropriate layer and demographic fields to use. See To Change the Aggregation Method when Calculating Demographics for information on changing these fields.
- To count the features in each area of influence, choose the layer whose features you want to count and the features to use from the Layer and Using drop-down lists.
- To subtotal the counted features, choose a field to use for grouping and the category types to group or choose None to get the total count of features without subtotaling. For example, you could use the "Type" field in the landmark layer and choose to find the number of restaurants and schools within the areas of influence.
- Choose a field from the feature count layer to aggregate from the Sum drop-down list. For example, you could calculate the total revenue of customers within the areas of influence.
- Click OK to return to the Straight Line Influence Areas dialog box.
- Click OK.
Maptitude creates a new layer containing the areas of influence and adds the new layer to the map. If you chose to produce an overlay, Maptitude creates the table and displays the results in a joined view. If you chose to create a report, Maptitude generates the report and displays it in a new window. Reports can be printed, saved, exported, and emailed. Close the report window when you are done.
Try It Yourself: Building Areas of Influence
1. Choose File>New Workspace, choose New map of my data/table/spreadsheet from the first scroll list, and click OK.
2. In the Tutorial folder, open the Excel spreadsheet with logistics data for your country (e.g., Logistics Australia.xlsx, Logistics United States.xlsx, etc.).
3. Choose the Clients sheet and click OK. Maptitude displays Create-a-Map Wizard.
4. Click Next>, choose the first "Locate" option in the scroll list, and click Finish. Maptitude locates 60 clients and displays the locate results.
5. Click OK to display the map with the located clients. You want to see the areas of influence for the clients.
6. Choose Tools>Analysis>Straight Line Influence Areas or click Straight Line Influence Areas in the analysis tools drop-down on the Standard toolbar.
7. Choose All Features from the Around drop-down list, [Client Name] from the Area Names From drop-down list, and click OK. Maptitude creates the areas of influence and adds them to the map.
8. Choose File>Close Workspace and click Don't Save to close the workspace without saving any changes.
©2026 Caliper Corporation