Maptitude Help / Geographic Analysis Tools / Creating Desire Lines
Creating Desire Lines
Maptitude uses desire lines to illustrate on a map the flows of people or goods from point to point based on the values from a dataview. For example, a dataview could show the number of customers traveling to a store from their home ZIP Codes. The width of each of the desire lines would indicate the volume of flow.
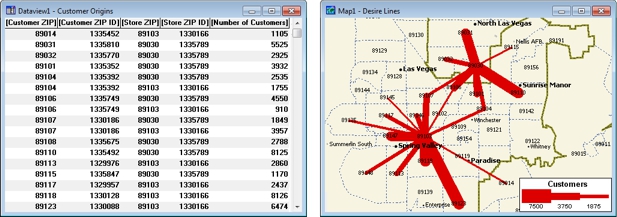
Maptitude displays desire lines by creating a new geographic file with lines that connect each origin and destination in the dataview. The layer is automatically displayed on a map using a size theme. For more information on size themes, see Size Themes.
In order to create the new line geographic file, Maptitude associates each From ID and To ID in the dataview with a point or area feature. You can create desire lines from all the rows and columns that are displayed in the dataview, or just a selection set.
 To Create Desire Lines
- Choose the point or area layer being used to create the desire lines as the working layer.
- Choose Tools>Analysis>Desire Lines or click
 Desire Lines in the analysis tools drop-down on the Standard toolbar to display the Desire Lines dialog box.
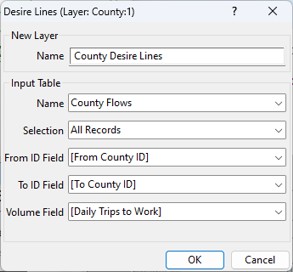
- Enter a name for the new desire line layer in the Name box.
- Choose to use all records or a selection set from the Selection drop-down list.
- Choose the origins and destinations to connect from the From ID Field and To ID Field drop-down lists.
- Choose the field that contains the volume of flow from the Volume Field drop-down list.
- Click OK.
Maptitude creates a geographic file containing the desire lines, and adds them to the map. If you chose a volume field, the desire lines are displayed with a size theme.
Try It Yourself: Creating Desire Lines
1. Choose File>Open Workspace or click  on the Standard toolbar, then open the Desire workspace in the Tutorial folder. You want to create desire lines illustrating the daily trips data contained in the dataview.
2. Choose Tools>Analysis>Desire Lines or click Desire Lines in the analysis tools drop-down on the Standard toolbar to display the Desire Lines dialog box.
3. Verify that County Flows is chosen in the Name drop-down list, All Records is chosen in the Selection drop-down list, [From County ID] is chosen in the From ID Field drop-down list, and [To County ID] is chosen in the To ID Field drop-down list.
4. Choose [Daily Trips to Work] from the Volume Field drop-down list.
5. Click OK. Maptitude adds the desire lines to the map with a size theme showing the flows.
6. Choose File>Close Workspace and click Don't Save to close the workspace without saving any changes.
©2026 Caliper Corporation