Maptitude Help / Routing, Directions, and GPS / Creating Drive-Time Rings
Creating Drive-Time Rings
A drive-time ring encloses an area in which all or selected links or nodes in a line layer are within a certain cost, or value limit, of one or more origins. You can create drive-time rings that show the locations that are within a certain amount of time from the origins, or you can create distance rings that show the locations that are within a driving distance of the origins.
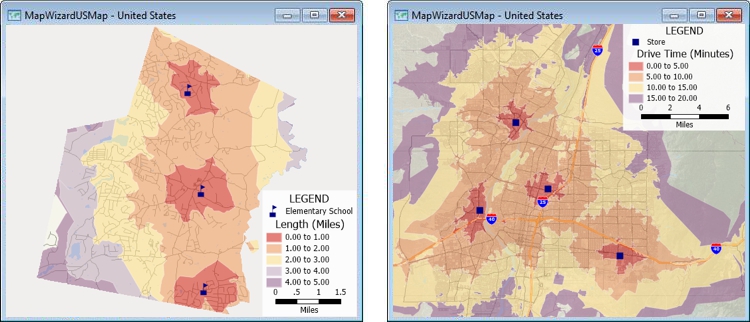
One-mile interval distance rings (left) show the areas from one to five miles from a school. Five-minute drive-time rings (right) show the areas from five to twenty minutes from a store.
You choose the origins for the rings by clicking on the map or by using features in a point layer. You then choose the number of rings and the interval. Drive-time rings are specified in minutes and distance rings use the map units (e.g., miles or kilometers).
 |
NOTE: You can choose to see the map scale in other units. Choose Edit>Preferences and choose the units from the Map Units drop-down list on the System tab. |
When you have more than one origin, you can choose whether the rings are merged or separate. For example:
|
|
|
|
Three merged rings show you the areas 0-5, 5-10, and 10-15 minutes from any origin |
Six separate rings show you the areas 0-5, 5-10, and 10-15 minutes from each of the two origins |
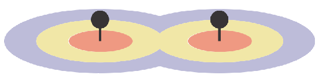
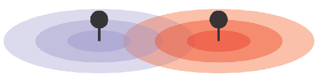
When you create drive-time rings, you can choose to calculate demographics for the rings. If you create merged rings, you can choose whether the demographics are for the individual rings or cumulative as illustrated here:
|
|
|
|
|
If you create three buffers at 1-mile intervals like these |
...you can calculate the demographics in each buffer (i.e., within 0-1, 1-2, and 2-3 miles)... |
...or you can calculate the cumulative demographics for the buffers (i.e., within 0-1, 0-2, and 0-3 miles) |
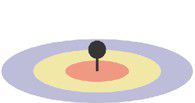
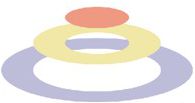
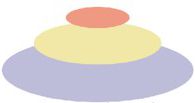
If you create separate rings, the demographics will be cumulative.
You can create up to 1000 rings with no limit on distance or time. Once you create your rings, you can also create a formatted report with the resulting map and demographics.
 |
For a video tutorial see: (Internet connection required) |

- Choose Tools>Routing & Directions>Drive-Time Rings or click
 Drive-Time Rings in the analysis tools drop-down on the Standard toolbar to display the Drive-Time Rings toolbar.
 - Choose whether to create the rings using the fastest time or shortest distance from the Route Type drop-down list.
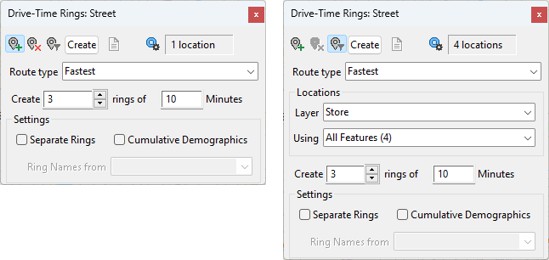
- The toolbar has different options for when you choose origins by clicking on the map (left) or by using features in a point layer (right). Choose how you want to define your origins as follows:
| To do this... | Do this... |
|---|---|
| Choose the origins by clicking on the map | Click  in the Drive-Time Rings toolbar and click on one or more locations on the map. Click in the Drive-Time Rings toolbar and click on one or more locations on the map. Click  if you want to clear the locations and start over. if you want to clear the locations and start over. |
| Choose the origins from features in a point layer | Click  in the Drive-Time Rings toolbar, choose the point layer that contains the origins from the Layer drop-down list, and choose whether to use all records in the point layer or a selection set from the Using drop-down list. in the Drive-Time Rings toolbar, choose the point layer that contains the origins from the Layer drop-down list, and choose whether to use all records in the point layer or a selection set from the Using drop-down list. |
- Specify the number of rings in the Create box and enter the ring interval in minutes (Fastest) or map units (Shortest).
- Check the Separate Rings box if you want to create separate rings around each origin or leave it unchecked to create merged rings.
If you are using a point layer for the origins and creating separate rings, choose a field in the point layer for identifying the rings from the Ring Names from drop-down list. - Check the Cumulative Demographics box to calculate cumulative demographics for outer rings or leave it unchecked to calculate demographics for just the rings themselves.
- Optionally, click
 in the Drive-Time Rings toolbar to display the Drive-Time Rings Configuration dialog box and modify the direction, overlay settings, driving speeds, or streets to include. On the Settings tab choices as follows:
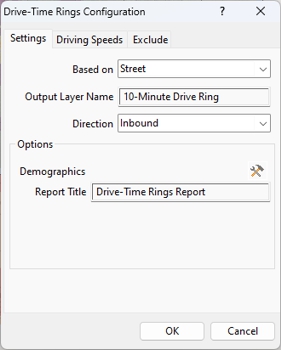
- To use a line layer in your workspace other than streets, choose a layer from the Based on drop-down list
- To change the name of the drive-time ring layer edit the text in the Output Layer Name box
- Choose whether to build the bands from the origins (Outbound) or to the origins (Inbound) from the Direction drop-down list
- Enter a Report Title if you will be creating a report
To specify the attributes to calculate and/or the features to count in the rings, click  to display the Demographic Settings dialog box and make choices as follows:
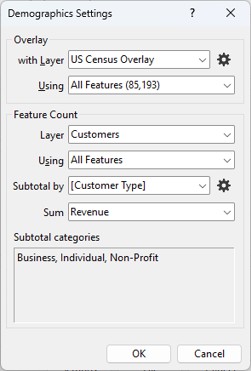
- Choose a reference layer with demographics and the features to use from the with Layer and Using drop-downs list. Typically Maptitude will choose an appropriate layer and demographic fields to use. See To Change the Aggregation Method when Calculating Demographics for information on changing these fields.
- To count the features in each ring, choose the layer whose features you want to count and the features to use from the Layer and Using drop-down lists.
- To subtotal the counted features, choose a field to use for grouping and the category types to group or choose None to get the total count of features without subtotaling. For example, you could use the "Type" field in the landmark layer and choose to find the number of restaurants and schools within the rings.
- Choose a field from the feature count layer to aggregate from the Sum drop-down list. For example, you could calculate the total revenue of customers within the rings.
- Click OK to return to the Drive-Time Rings Configuration dialog box.
To adjust speeds for the street layer, click the Driving Speeds tab and choose the Factors option in the radio list to use the sliders to make the speeds faster or slower for the different road classes or choose the Target Speeds option in the radio list to enter target speeds for some different road classes. The sliders correspond to speeds factors 1/5, 1/3, 1/2, 1, 1.176, 1.538, and 2. Driving speeds can only be adjusted when using the 2016 or later version of the HERE street file.
To exclude some links from the analysis, click the Exclude tab and check the All Ferries box to exclude traveling on ferries and/or check the Selected Links box and choose a selection set that contains the links to exclude from the Selection Set drop-down list.
Click OK to close the Drive-Time Rings Configuration dialog box.
- Click Create.
Maptitude creates the rings, adds them to the map, and displays them with a color theme so that they are easy to see. For more information on color themes, see Color and Pattern/Symbol Themes.
- If you want to compute the demographics for the rings, click
 in the Drive-Time Rings toolbar. Maptitude calculates the demographics, displays the results in a dataview, and generates a report in a new window. Reports can be printed, exported, and emailed. Close the report window when you are done.
 |
TIP: You can also export demographic data to Excel by making the resulting drive-time rings layer the working layer and clicking |
 on the Standard toolbar.
Try It Yourself: Creating Drive-Time Rings
1. Choose File>New Workspace or click  on the Standard toolbar, choose New map of {country name}, then use Create-a-Map Wizard to create a map of the city where you live.
2. Choose Tools>Routing & Directions>Drive-Time Rings or click Drive-Time Rings in the analysis tools drop-down on the Standard toolbar to display the Drive-Time Rings toolbar.
3. Click in the Drive-Time Rings toolbar to activate the Click Locations tool.
4. Click on your location on the map.
5. Verify that Fastest is chosen from the Route Type drop-down list, change the number of rings to 3, and change the size of the rings to 10 minutes.
6. Click Create in the Drive-Time Rings toolbar. Maptitude creates the rings and adds them to the map along with a color theme to illustrate the driving times. Now you can see the areas that are 0-10, 10-20, and 20-30 minutes from the location you clicked. Any portion of the map that is not covered by a ring is greater than 30 minutes from your location.
7. Click in the Drive-Time Rings toolbar. Maptitude computes the demographics, displays them in a dataview, and opens a Report showing the results.
8. Scroll down the report to see a map of the drive-time rings on the first page and demographic information on the second page. The demographics will vary depending on the Country Package you are using.
9. Close the report window and choose File>Close Workspace to close the workspace. Choose Don't Save to close them without saving the changes.
©2026 Caliper Corporation