Maptitude Help / Using Themes to Present Information / Color and Pattern Themes
Color and Pattern/Symbol Themes
Color themes and pattern/symbol themes work in the same way. They both group the features in a map layer into classes, based on the value of a data field. Each class contains all of the features with similar values for the chosen field. When the map is drawn, the classes are displayed using different colors, patterns (area and line layers), or symbols (point layers).
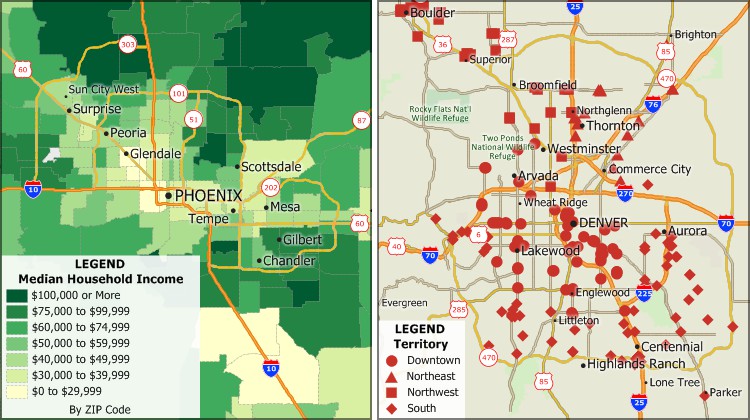
A color theme of income classes (left) and a multiple symbol theme showing customer territory assignments (right)
In this topic:
- Options for Color and Pattern/Symbol Themes
- Creating Color and Pattern Themes
- Setting Up Classes Manually for a Color or Pattern Theme
Options for Color and Pattern/Symbol Themes
There are many options you can choose when creating a color or pattern/symbol theme.
Methods
Maptitude lets you set up the classes using any of several methods, described in the following table:
| Method | Description |
|---|---|
| Equal number of features | Each class has the same number of features. If you ask for four classes, each one will contain one-fourth of the features. |
| Equal size intervals | Each class has the same range of numbers (for example, 0–1000, 1000–2000, and so on). |
| Optimal breaks | Clusters values that minimize within-group variance using the Fisher-Jenks Algorithm (Natural Breaks). |
| Equal feature area | Total land area in each class is approximately the same. Only used for area features. |
| Equal feature length | Total length of features in each class is approximately the same. Only used for line features. |
| List of values | Each value is assigned to a separate class. Useful when only a few numeric values exist. |
| Standard deviation | Features are split based on a number of standard deviations above and below the mean. |
| Nested averages | Features are recursively split based on the average value. |
| Manual | Class boundaries or feature percentages are manually defined. |
Number of Classes
Maps communicate most effectively when there are only a small number of classes, about five or six. Maptitude lets you choose to create up to 512 classes in your themes.
The number of classes that appear in your theme may be higher or lower than you ask for. For example, Maptitude adds an extra class (called “Other”) when there are features that have no data or that contain a value not assigned to any class. Also, if you ask for eight classes when there are only six features on the map, you will get fewer classes than you asked for.
 |
NOTE: To choose the default number of classes to use, choose Edit-Preferences and click the Theme tab. |
Ignore Values Above or Below
These options let you create a theme that ignores features with values higher or lower than some limit you set. For example, you could create a color theme showing the sales volume of all your large customers by ignoring the ones with a sales volume below a certain level. Features whose values are not within the range you choose are assigned to the “Other” class.
Std. Dev. Per Class
When you use the standard deviation method, Maptitude creates classes that are one standard deviation in size. To change the size of the classes, enter a different number here.
Break At
This option forces a separation between classes at the value you specify. Use the Break At option to make sure that features with values below zero are shown differently from those with values above zero. For example, if you are creating a theme to illustrate a field called Population Growth, this option makes sure that areas with positive population growth look different from areas with negative population growth. You can also use a number other than zero. For example, you could use the number 100 if your data were percentages and you wanted to distinguish features with values above or below 100 percent.
Treat Zeros as Missing Values
Some database programs, like dBASE, have no way of indicating that a particular piece of data is missing or unavailable. A zero value for Population in a dBASE file may mean the population is zero, or it may mean the population is unknown.
If this option is checked, Maptitude assumes that a value of zero means that the real value is not known. Features with a zero value will be placed in the “Other” class, and Maptitude will not take them into account when building the classes.
Round Off the Values in Each Class
If this option is checked, Maptitude rounds off the low and high values in each class to make the legend easier to read. Maptitude rounds off each number as much as it can without changing the assignment of features to classes.
Include Counts in Legend
If this option is checked, the legend will display the number of map features that fall within each class.
Styles
For any class in a color, pattern, or symbol theme, you can customize the style and change the text that describes it in the map legend. This lets you tailor every aspect of a thematic map.
Maptitude includes a collection of predefined color and pattern sets. If you choose one of these predefined color or pattern sets, Maptitude will update the appearance of all the classes in that theme. You can also update the style of each class individually.
|
NOTE: To choose the default colors or patterns for themes, choose Edit-Preferences and click the Theme tab. |
Maptitude has a special color ramp feature you can use to set the colors for a color theme. The color ramp lets you pick a starting color and an ending color, and then fills in the rest of the colors to make a gradual transition from the first to the last. If you used the Break At option described above you can pick a starting color, a color for the break point, and an ending color, and let Maptitude fill in the rest.
Creating Color and Pattern Themes
You create color, pattern, and symbol themes in exactly the same way. You choose the layer you want to map, then pick the data field you want to see or create a formula field. MapWizard will take care of the rest, or you can customize the map settings to display the data any way you want.
When you create a theme using a formula field instead of an existing data field, Maptitude adds the formula field to the layer. You can then display that formula field in a dataview and use it to create more themes or to label map features.
If you update data for any records and they no longer fall within the theme classes, the features will be placed in the “Other” class. You can recalculate the classes, based on the current settings, by clicking Recalculate. This will not change the number or style of the classes, but may change the lower and upper bounds of the classes based on the up-to-date data.
If you create a color or pattern theme for non-topological areas, the theme is normally applied to the border rather than to the fill. A color theme will be displayed as a thin black line with the color for the class on the inside of the border. A pattern theme will be displayed as a line pattern for each class. Where areas share edges, the line pattern will be that of the last area to be drawn.
 |
For a video tutorial see: (Internet connection required) |
 To Add a Color, Pattern, or Multiple Symbol Theme to a Map
- Choose the layer you want from the drop-down list on the Standard toolbar.
- Choose Map>Thematic Mapping>Color or click
 Color Theme in the thematic mapping drop-down on the Standard toolbar to display the Color Theme dialog box (or to create a symbol theme on a point layer or a pattern theme on an area or line layer click
  , choose Map>Thematic Mapping>Multiple Symbol, or choose Map>Thematic Mapping>Pattern).
 - Choose a field from the Field drop-down list, or choose "Formula" at the end of the list to create a formula field. Type several letters to limit the fields in the drop-down list to those containing the text you enter.
|
NOTE: For more information on formula fields, see Creating a Formula Field. |
 |
TIP: Once you have expanded the Field drop-down list, type several letters to limit the fields to those containing the text you enter. |
- MapWizard fills in all the other settings in the dialog box. Modify any of the other settings as follows:
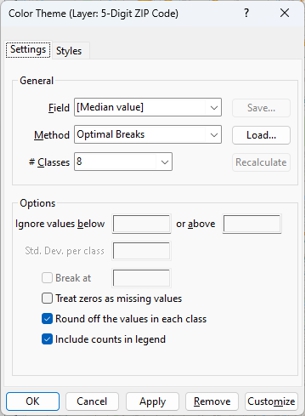
| To do this... | Do this... |
|---|---|
| Change the method | Make a choice from the Method drop-down. If you choose the Standard Deviation method, enter a value in the Std. Dev. per class box. |
| Change the number of classes | Choose a value from the # Classes drop-down. |
| Ignore low or high values from the theme classes | Enter a value in the Ignore values below box and/or the or above box. |
| Set a break point for the theme | Check the Break at box and enter the break point value |
| Treat zeros as missing values | Check the Treat zeros as missing values box |
| Round off low and high values as much as possible without changing the assignment of features to classes | Check the Round off the values in each class box |
| Display the number of features in each class | Check the Include counts in legend box |
|
NOTE: To learn about using the Save and Load buttons, see Saving Theme Settings. |
- Click the Styles tab and make choices as follows for color themes:
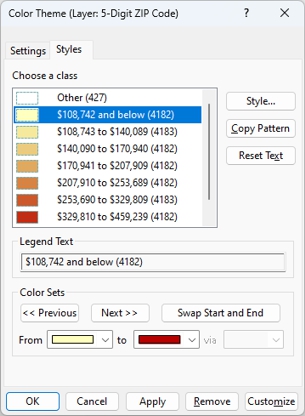
| To do this... | Do this... |
|---|---|
| To browse through the included color ramps | Click <<Previous or Next>>. |
| To reverse the color ramp | Click Swap Start and End. |
| Create a custom color ramp | Choose a start color from the From drop-down and a finish color from the to drop-down. If the break point option was used, also choose a color from the via drop-down. |
| To change the style of a class | Highlight a class in the scroll list, click Style, make changes in the Style dialog box, and click OK. For more information on styles, see Using Styles. |
| Change the text for a class | Highlight a class in the scroll list and edit the text in the Legend Text box. |
| Revert the legend to default legend text | Click Reset Text. |
| Copy a fill pattern to every class | Highlight a class in the scroll list and click Copy Pattern. |
| Use a border theme on non-topological areas | Check the Use Border Styles box |
Make choices as follows for pattern/symbol themes:
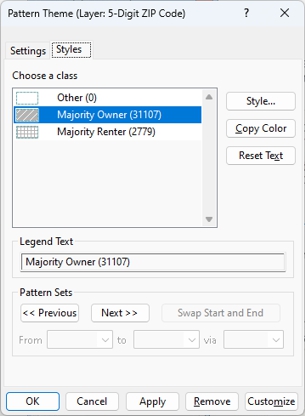
| To do this... | Do this... |
|---|---|
| To browse through the included pattern sets | Click <<Previous or Next>>. |
| To change the style of a class | Highlight a class in the scroll list, click Style, make changes in the Style dialog box, and click OK. For more information on styles, see Using Styles. |
| Change the text for a class | Highlight a class in the scroll list and edit the text in the Legend Text box. |
| Revert the legend to default legend text | Click Reset Text. |
| Copy a fill color to every class | Highlight a class in the scroll list and click Copy Color. |
- Click OK.
Maptitude draws the map with the color or pattern theme and displays a legend.
To Change a Color or Pattern Theme
- Choose the appropriate command from the Map>Thematic Mapping submenu or click Color Theme or Pattern Theme in the thematic mapping drop-down on the Standard toolbar.
- Change the field, method, number of classes, options, and styles as desired.
If you just want to recalculate the classes, based on the current settings, to reflect changes to the data, click Recalculate. You can preview the changes by clicking Apply.
- Click OK.
Maptitude draws the map with the modified theme.
To Create a Color Theme from a Dataview
- Select the data field you want to map by clicking on the column heading. Maptitude highlights the entire column.
- Choose Map>Thematic Mapping>Color.
Maptitude creates a new map that uses a color theme to illustrate the values of the chosen field.
 |
To create a theme from a dataview, the data must be connected to a map, otherwise the thematic mapping commands are disabled. To join data to a map use Create-a-Map Wizard or see Joining Your Data to a Map. |
To Temporarily Hide a Color, Pattern, or Multiple Symbol Theme
- In the Display Manager, click
 next to the theme.
Maptitude hides the theme on the map and displays a  symbol next to the theme in the Display Manager. Click to turn the theme back on.
To Turn Off a Color, Pattern, or Multiple Symbol Theme
- Choose the appropriate command from the Map>Thematic Mapping submenu or click Color Theme or Pattern Theme in the thematic mapping drop-down on the Standard toolbar.
- Click Remove to clear the settings and close the dialog box.
Maptitude draws the map without the theme.
Try It Yourself: Creating Color Themes
1. Choose File>Open or click  on the Standard toolbar, then open the NESouth workspace in the Tutorial folder. The map has two layers, County and Highway, for southern New England.
2. Right-click on County in the Display Manager and choose Make Working Layer.
3. Click Color Theme in the thematic mapping drop-down on the Standard toolbar.
4. Choose Population from the Field drop-down list and click OK to see a color thematic map of county population divided into eight classes.
5. Click again.
6. Choose 6 from the # Classes drop-down list, click the Styles tab to display the Style page, and click Next>> until you find a color set you like.
7. Click OK to see the theme with six classes and your chosen color set.
8. Click a third time, then click Remove to remove the color theme.
9. Right-click on Highway in the Display Manager and choose Make Working Layer.
10. Click , choose Lanes from the Field drop-down list, choose List of Values from the Method drop-down list, and click OK. The highways are drawn showing different colors for different numbers of lanes.
11. Choose File>Close Workspace and click Don't Save to close the workspace without saving any changes.
Setting Up Classes Manually for a Color or Pattern Theme
When you create a color or pattern theme, you have the option to manually customize the classes. To do this, you choose the number of classes you want to create, and then enter one of the following for numeric fields:
• The low and high value for each class (Low & High Values and Steps methods)
• The number of features in each class (Counts method)
• The percentage of features in each class (Percents method)
For string fields, choose the number of classes you want to create and then enter the value for each class.
When you set the low and high values for each class, you are free to leave gaps between the classes. You could, for example, create a theme with some classes for very high values, and some classes for very low values, but no classes for values in the middle. This theme would not highlight the map features with middle or average values, but would highlight the highest and lowest.
When you choose the number or percentage of features in each class, you can choose whether you want to include features starting with the highest or the lowest values of the chosen data field. For example, suppose you have a tax parcel database that contains the property value for each parcel. You could create a theme with three bins, containing 5 percent, 10 percent, and 25 percent of the parcels, starting with the highest value. The theme would show the highest valued properties in three groups, and properties that are not in the top 40 percent would be placed in the Other class.
To Create a Color or Pattern Theme with Manual Classes
- Choose Map>Thematic Mapping>Color or click Color Theme in the thematic mapping drop-down on the Standard toolbar to display the Color Theme dialog box (or choose Map>Thematic Mapping>Multiple Symbol to display the Pattern Theme dialog box for a point layer, or choose Map>Thematic Mapping>Pattern to display the Pattern Theme dialog box for an area or line layer).
- Choose a field from the Field drop-down list, or choose Formula at the end of the list to create a formula field. MapWizard fills in all the other settings in the dialog box.
|
NOTE: For more information on formula fields, see Creating a Formula Field. |
- Click Customize to display the Manual Theme dialog box.
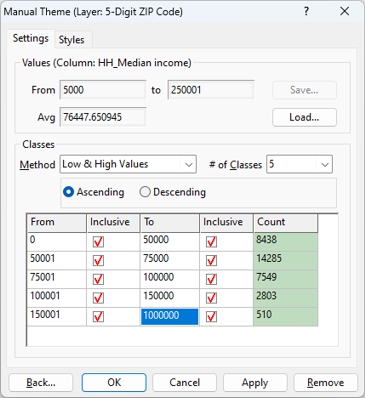
- Choose a method and make choices as follows:
| Method | How to use it... |
|---|---|
| Low & High Values | Type the low and high value for each class. Check Inclusive to include the value in the range. |
| Counts | Type the number of features in each class. Check Highest Values or Lowest Values to start with the features with the highest or lowest values. |
| Percents | Type the percentage of features in each class. Check Highest Values or Lowest Values to start with the features with the highest or lowest values. |
| Steps | Type the low value to use to start the first class and the type the step interval. |
| List of Values | Type the value for each class |
|
TIP: If your field uses codes and you are using the List of Values method, you can click Create From Codes to automatically create classes based on your codes. For more information on field codes, see Working with Codes. |
- Choose whether to list the classes in Ascending or Descending order in the legend using the checkboxes.
- Click OK.
Maptitude draws the map with the color or pattern theme and displays a legend.
Maptitude will never put features that have identical values into separate classes. As a result, a class may contain more features than you asked for.
If the total of the counts or percents you enter is more than the number of features, Maptitude will create classes until it runs out of features, and then it will stop. If the total of the counts or percents you enter is less than the number of features, Maptitude will put the remaining features into the Other class.
Try It Yourself: Creating Manual Themes
1. Choose File>Open or click on the Standard toolbar, then open the NESouth workspace in the Tutorial folder.
2. Right-click on County in the Display Manager and choose Make Working Layer.
3. Click Color Theme in the thematic mapping drop-down on the Standard toolbar.
4. Choose [Per Capita Income] from the Field drop-down list and 4 from the # Classes drop-down list.
5. Click Customize to display the Manual Theme dialog box.
6. Change the To value in the first row to 14999.
7. Change the From and To values in the second row to 15000 and 19999.
8. Change the From and To values in the third row to 20000 and 24999
9. Change the From value in the fourth row to 25000.
10. Click OK. Maptitude draws the map with the a color theme showing your manual theme settings.
11. Choose File>Close Workspace and click Don't Save to close the workspace without saving any changes.
©2026 Caliper Corporation