Maptitude Help / Using Your Data: Advanced Topics / Joining Your Data to a Map
Joining Your Data to a Map
With Maptitude you can make maps from your data, enabling you to visualize the data in new and different ways. If your database includes postal codes, state abbreviations, tract or county codes, or ISO country codes, you should use Create-a-Map Wizard to automatically create a thematic map of your data joined to the appropriate layer. See Using Create-a-Map Wizard for more information.
If, however, you want to join your data to a layer not supported by Create-a-Map Wizard, you can join your data to a map layer by matching the records in your file to the features in a geographic file. This creates a joined view. For example, if you have a spreadsheet of sales data by territory, you can join that to a sales territory layer and then create maps that use the spreadsheet data.
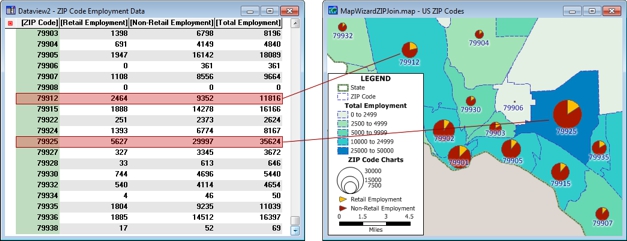
Creating a Joined View
To create a joined view you need to:
- Choose the layer you want to use and display it in a map or dataview.
- Choose the spreadsheet or table that contains the data to join
To join the layer and your data, the values in one of the fields in your data must exactly match the values in one of the fields of the layer. The column headings or names of the fields can be different, as long as the values match. For example, you can link a sales dataview to a state layer, as long as both of them have a field containing the name of the state or the state abbreviation. If, however, your data do not match exactly, you will need to create a field with values that do. See Values That Don’t Match.
You can also define a join using more than one field. For example, you may have two dataviews with origin and destination fields where one shows trip data and the other shows travel times. You can create a joined dataview that shows the trip data and the travel times by choosing the Multiple Fields option and specifying the origin and destination fields in each dataview. When joining with multiple fields, the following rules apply:
- The number of fields needs to be the same for both dataviews
- The fields must be specified in the same order
- If one field type is numeric then the other must also be numeric
- If one field type is DateTime then the other must also be DateTime
Once you have created a join, Maptitude lets you see the tables and layers that make up the joined view.
Editing Data in a Joined View
There are two minor restrictions on editing data in a joined view.
- You cannot edit the two fields you used to create the joined view, because these fields are the glue that holds the two files together.
- You cannot add or delete records, since what appears to be a single record in the joined view is really a combination of data from two different places.
When Column Headings Collide
Sometimes the field names from your data file are exactly the same as the field names from a map layer. When you join these two files together to create a joined view, Maptitude automatically changes the field names so you can tell which column comes from what source.
For example, suppose you join States (which has ID, Name, and other data fields) to Customers (which has ID, Name, and other data fields). Maptitude changes the column headings to States.ID, States.Name, Customers.ID, and Customers.Name. The first two columns contain data from the states layer. The third and fourth columns contain data from your customer file.
 |
For a video tutorial see: (Internet connection required) • Joining Your Data to a Maptitude Map: Joining data in a spreadsheet or table to a layer in a Maptitude map • Using Maptitude in Conjunction with Microsoft Excel: Attaching Excel data to maps, geocoding Excel data, exporting to Excel using the drawing tools, exporting analysis results to Excel, and joining Excel data to a map layer |
- Choose Dataview>Table>Join or, if a dataview is the active window, click
 on the Standard toolbar to display the Join dialog box.
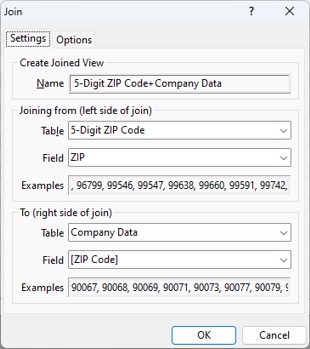
- In the Joining from (left side of join) frame, choose the map layer to join with your data and choose a field that contains data that can be matched to a field in your data. You can filter either drop-down list by expanding it and typing a portion of a field name.
- In the To (right side of join) frame, choose the dataview that contains the data to join, or choose File Open and specify a table or spreadsheet file to use for the join, and choose a field that contains values that match the field chosen in the previous step.
You can also define a join using more than one field by choosing Multiple Fields from the Field drop-down lists. Choosing Multiple Fields will display the Choose Fields to Join dialog box. Choose from the fields to use from the Available Join scroll list and click Add>> then OK. Be sure to choose the same number of fields and in the same order in both instances.
- Type a name or edit the suggested name for the joined view in the Name text box.
- Click OK.
Maptitude creates a joined view, linking the map layer to the dataview that contains your data.
You don’t need to do anything special to save a joined view. When you save a map, layout, dataview, or workspace that is based on a joined view, Maptitude saves the joined view automatically.
When you open a map, dataview, or layout that contains a joined view, Maptitude recreates the link from the map layer to your data. If the values in your data file have changed (for example, if your corporate database has been updated or you used some other software package to modify the information in the file), the map or dataview will show all of those changes. Consequently, your maps, layouts, and dataviews automatically use the most recently available data.
Try It Yourself: Creating and Using a Joined View
1. Choose File>Open Workspace or click  on the Standard toolbar, then open the USsales workspace in the Tutorial folder. Maptitude shows a map of states and a dataview of sales by state. By joining them, you can prepare maps of sales by state.
2. Choose Dataview>Table>Join to display the Join dialog box.
3. Choose [Abbrev.] from the first Field drop-down list.
4. Choose STSALE from the second Table drop-down list. Maptitude automatically finds the ABBREV field in the STSALE table.
5. Type “Sales by State” as the name for the new dataview.
6. Click OK. Maptitude displays the new dataview with all of the fields from both the States layer and the STSALE dataview.
7. Scroll to the far right of the joined dataview, click on the Total column heading, and choose Map>Thematic Mapping>Color. Maptitude creates a new color theme map of the sales for the year.
8. Choose Map>Thematic Mapping>Chart or click  Chart Theme in the thematic mapping drop-down on the Standard toolbar to display the Chart Theme dialog box. Click and drag on the QUARTER1, QUARTER2, QUARTER3, and QUARTER4 fields to highlight them.
9. Click OK. Maptitude adds pie charts to the map to show the proportion of sales in each quarter for each state.
10. Choose File>Close Workspace and click Don't Save to close the workspace without saving any changes.
Seeing the Structure of a Joined View
Maptitude lets you see the tables and layers that make up a joined view.
 To See the Structure of a Joined View
- Right-click on the dataview window and choose Properties. Maptitude displays the Dataview Properties dialog box.
- Click
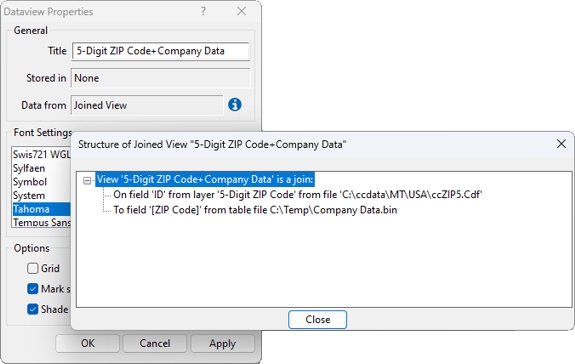
 to display the Structure of Joined View dialog box. The tree shows the structure of the joined view.
 - Expand the tree to see the source files that comprise the joined view.
- Click OK when you are done to return to the Dataview Properties dialog box.
- Click OK or Cancel to close the Dataview Properties dialog box.
 |
TIP: You can also get to the Dataview Properties dialog box by clicking |
 on the Standard toolbar and then clicking
  in the Properties column of the dataview you want to modify.
Dropping a Joined View
When you create a joined view by joining a table to a layer, Maptitude keeps the joined view available as long as the layer appears in any open map, dataview, or layout. When the layer is no longer in use, the joined view is automatically discarded.
Sometimes you may want to get rid of a joined view while the layer is still in use. For example, suppose you chose the wrong fields when you created the joined view and you want to recreate it using the correct fields.
You can drop a joined view while it is displayed in a dataview. When you do so, Maptitude closes the dataview as it drops the joined view. You cannot, however, drop a joined view when it is part of another more complex join or when it is being used in a map to display a theme or labels.
To Drop a Joined View
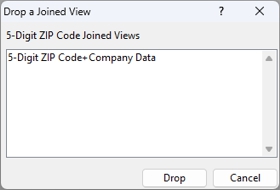
- Choose one or more joined views to drop.
- Click Drop.
Maptitude drops the joined views, and closes any dataviews in which they are displayed. A joined view that is not associated with a layer is dropped when its dataview is closed.
Values That Don’t Match
To create a joined view, the values in one of the columns of the layer must match the values in one of the columns of the dataview. Maptitude automatically handles cases where your data don’t match the records in a map layer.
- If your data include records that don’t match any of the features of the map, those records will not be part of the joined view. (For example, the joined view of a table that contains data by state and country that you join to a country layer will not contain any of the state data.)
- If the map layer has features that don’t have matching records in your data file, the joined view will show that the data for those features are missing. (For example, the joined view of a table that contains data for some countries that you join to a country layer will show values for the countries that had data and null values for all other countries.)
In addition, the fields that you use to create a join must match exactly. For example, if you join a table that contains a record with the name “CALIFORNIA” it will not join to a feature with the name “California.” In this case, you need to use a formula field to create a new column in one of the files that matches the data in the other file. The following tables show some common functions that you may use to make formula fields match.
| Field | Formula | Formula Description | Returns |
|---|---|---|---|
| California | Upper(Field) | Converts values in Field to upper case | CALIFORNIA |
| CALIFORNIA | Proper(Field) | Converts values in Field to initial capitals | California |
| 02461-9926 | Substring(Field,1,5) | Returns the first five characters in Field | 02461 |
| Newton MA | Left(Field,Len(Field)-3) | Returns all but the last three characters of Field | Newton |
| Newton, MA | Substring(Field,1,Position(Field,",")-1) | Returns all of the characters up to the one before the comma | Newton |
| Interstate 495 | Word(Field,2) | Returns the second word in Field | 495 |
| US Hwy 101 | "US-"+Substring(Field,8,3) | Combines "US-" with the 8-10th characters of Field | US-101 |
| US Hwy 101 | "US-"+Word(Field,3) | Combines "US-" with the third word in Field | US-101 |
| Field1 | Field2 | Formula | Formula Description | Returns |
|---|---|---|---|---|
| JANE | SMITH | Field1+" "+Field2 | Combines the fields with a space between them | JANE SMITH |
| 1172 | BEACON ST | String(Field1)+" " +Field2 | Converts an integer in Field1 to a string then combines the fields with a space between them | 1172 BEACON ST |
There may often be several formulas that return similar results, but, depending on the data, some may be better to use than others. For example, you can use the following five formulas to trim the state abbreviation off of a city name field, but only two will give the proper results if the city name has more than one word in it.
| Formula | Returns this for “CHICAGO IL” | Returns this for “LOS ANGELES CA” |
|---|---|---|
| Left(NAME,Len(NAME)-3) | CHICAGO | LOS ANGELES |
| Substring(NAME,1,Len(NAME)-3) | CHICAGO | LOS ANGELES |
| Word(NAME,1) | CHICAGO | LOS |
| Left(NAME,Position(NAME," ")-1) | CHICAGO | LOS |
| Substring(NAME,1,Position(NAME," ")-1) | CHICAGO | LOS |
For more information on formula fields, see Creating a Formula Field. See Formulas, Conditions, and Functions for more information on functions supported in Maptitude.
Types of Joined Views
When you join a layer and a table to create a joined view, there is often a one-to-one correspondence between the records in the layer and the records in the table. For example, when you join the States layer to the Your Sales Data table shown below, each record in the States layer matches exactly one record in the Your Sales Data table.
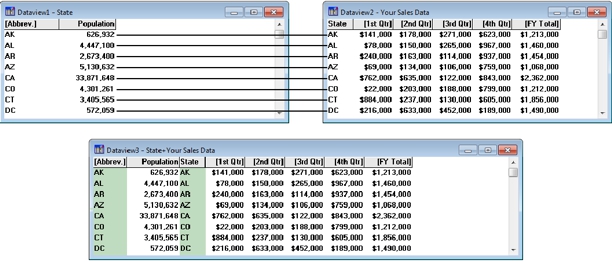
Sometimes the layer and the table do not match record for record. There are two distinct possibilities:
- The layer has several records that match a single record in the table. This is called a many-to-one joined view.
- The layer has one record that matches several records in the table. This is called a one-to-many joined view.
In the following tables of customers and stores there is not a one-to-one correspondence.
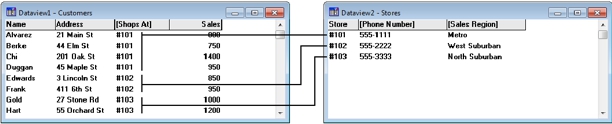
You can join from the Customers to the Stores as a many-to-one joined view. Many of the customers shop at the same store and the information about each store is repeated for each customer who shops there.
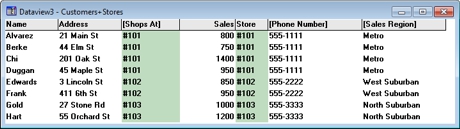
You can also join from Stores to Customers as a one-to-many joined view. You have two choices using the example:
- Aggregate One-to-Many Join: Each store has many customers so Maptitude counts the total number of customers at each store, and calculates the sum and average of each numeric field. This join is mappable, but you cannot see the fields for each customer.
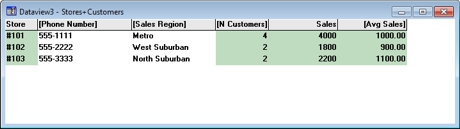
- One-to-Many Join: Maptitude displays a record for each customer and repeats the fields for the stores on the left. This join is not mappable, but you can see each of the customer fields.
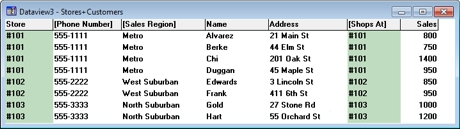
Usually, Maptitude can automatically tell whether the layer and the data table should be joined one-to-one or one-to-many. If you want to make sure the data are joined the way you want, use the Options tab in the Join dialog box.
To Specify the Type of Joined View
- Choose Dataview>Table>Join or, if a dataview is the active window, click on the Standard toolbar to display the Join dialog box.
- Choose the layer, table, and matching fields in the usual way.
- Click the Options tab.
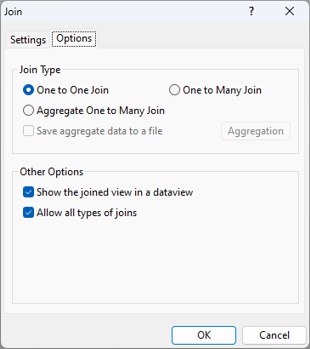
- Choose the type of join you want from the list in the Join Type box.
- If you choose an aggregate one-to-many join, you can also choose one or more of the following options:
| Option... | See... |
|---|---|
| Save aggregate data to a file | “To Save Aggregate Data to a File” below. |
| Change the aggregation method | To Change the Aggregation Method when Creating a One-to-Many Join. |
- Click OK to create the joined view.
- Right-click on a dataview with an aggregate one-to-many join and choose Joined Records Browse. Maptitude displays the track joined records dataview with the fields for the joined table.
- When you are done tracking joined records, click the close box in the upper-right corner of the track joined records dataview.
Maptitude closes the track joined records dataview.
Try It Yourself: Creating a One-to-Many Join
1. Choose File>Open Workspace or click on the Standard toolbar, then open the AvgSales workspace in the Tutorial folder. The dataview shows the sales for each customer. You want to present the average sales per customer and the sum of sales by state.
2. Choose Dataview>Table>Join to display the Join dialog box.
3. Choose [Abbrev.] from the first Field drop-down list.
4. Choose AVGSALES from the second Table drop-down list. Maptitude automatically finds the ABBREV field in the AVGSALES table.
5. Type “Average Sales” as the name for the new dataview.
6. Click OK. You will be asked to choose the type of join.
7. Click Aggregate the records in the right side of the join in the radio list and click OK. Maptitude shows the new dataview with the number of records, the sum of sales, and the average sales by state. Scroll to the right to see the [N AVGSALES], SALES, and [Avg SALES] fields.
8. Click on the [Avg SALES] heading, then choose Map>Thematic Mapping>Color. Maptitude creates a new color theme map showing average sales by state.
9. Choose File>Close Workspace and click Don't Save to close the workspace without saving any changes.
Saving Aggregate Data in a One-to-Many Join
When you create an aggregate one-to-many join, Maptitude computes the sum and average values for the records in the table that go with each record in the layer. This calculation is done on the fly each time Maptitude displays a dataview or uses the values in these fields to create a thematic map or label a map. If your files are very large, or there are many records in the table for each record in the layer, this can take a long time, and the calculation will be performed over and over.
You can speed things up by saving the results of these calculations to a separate file. The advantage is that once the data are saved, you can display the aggregate data in a dataview or use it in a map very quickly. The disadvantage is that changes to the data in your table won’t automatically be reflected in the joined view, unless you drop the joined view and then recreate it later on.
You can customize the way that Maptitude aggregates the data. For more information, see Aggregation Methods.
To Save Aggregate Data to a File
- Choose Dataview>Table>Join to display the Join dialog box.
- Choose the layer, table, and matching fields in the usual way.
- Click the Options tab and choose Aggregate One to Many Join type if it is not already chosen.
- Check the Save Aggregate Data to a File box.
- Click OK. Maptitude displays the Save As dialog box.
- Type a name for the table in which the aggregate data should be stored, and click OK.
Maptitude aggregates the data, stores it in a file, and creates the joined view.
More Complex Joined Views
The examples we’ve used so far show how to link a map layer to data of your own that are stored in a database or spreadsheet. In fact, Maptitude lets you create joins using any combination of map layers and data tables. For example, you can join a layer to a table (as discussed earlier in the chapter), join a layer to another layer, join a table to another table, join a layer to another joined view, or even join two joined views together to form another joined view. The only requirement is that the values in one column of the first layer, table, or joined view match the values in one column of the second layer, table, or joined view.
To Join Two Tables, Layers, or Joined Views
- Choose Dataview>Table>Join or click on the Standard toolbar to display the Join dialog box.
- Click the Options tab.
- Check the Allow All Types of Joins box.
- Click the Settings tab, and choose the tables, layers, or joined views and the fields in the usual way.
- Click OK.
Maptitude creates the joined view.
 |
NOTE: To make the Allow All Types of Joins option your default, choose Edit>Preferences and check the Allow All Types of Joins box on the Dataview tab. |
Faster Joins
When Maptitude joins geographic and tabular data, it builds a cross-reference between the two files with a temporary index (or a key) for the data fields that match between the two sources. (Maptitude makes these indexes temporary so that your original data files remain unchanged. This is important if you are sharing data with other users on a network.)
Each time you create the joined view or open a map, layout, or dataview containing the joined view, Maptitude must rebuild the temporary index. Unfortunately, this step can be time-consuming for large files.
Adding permanent indexes to your tables can result in faster joins. If your data have a permanent index, Maptitude will automatically use it whenever you join to the file. For more information about indexing a field, see To Modify the Structure of a Table.
©2026 Caliper Corporation