Maptitude Help / Working with Tables, Databases, & Charts / Dataview Advanced Topics
Dataview Advanced Topics
In addition to displaying data for native Maptitude geographic files and Excel files, you can view data from a number of additional sources in a dataview, create new tables from scratch, modify your existing tables. Maptitude dataviews can also handle codes and field sets, and can be used to determine summary statistics for an entire table or a selection set.
In this topic:
- Opening Dataviews from Other Sources
- Creating a New Table from Scratch
- Modifying the Structure of a Table
- Working with Codes
- Creating a Table from a Dataview
- Creating and Using Field Sets
- Computing Statistics
- Computing Spatial Autocorrelation
- Estimating and Evaluating Models
Opening Dataviews from Other Sources
You can display data from many sources in a Maptitude dataview including:
- ODBC tables
- ODBC SQL Query
- Oracle tables
- Microsoft Access tables
- Microsoft SQL Server tables
Creating a Dataview Using ODBC
ODBC drivers let Maptitude access data stored in many different formats. If you have the appropriate ODBC drivers, you can display and work with data from Access, DB2, Excel, Informix, Oracle, SAS, Sybase, and other database files within a dataview. Each ODBC driver is written for a specific data source file format. Most database manufacturers provide or offer ODBC drivers for their databases.
If you want to be able to edit the data, the ODBC table must have a unique field. This field should be indexed to improve performance. Maptitude can also handle large tables faster if there is an indexed unique field. Maptitude will look for a key field in the ODBC table and, if found, suggest it as the unique field and show whether it is indexed and whether it is a primary key.
You can also create a map layer from an ODBC table that has fields that contain a coordinate. For more information, see Creating a Map Layer from an ODBC Table.
 To Set Up Your Computer to Use ODBC
First you must install and configure one or more ODBC drivers. For installation instructions, refer to the documentation provided by the manufacturer of your ODBC driver. To configure an ODBC data source, use the ODBC Setup program in the Windows Control Panel, and follow the directions provided by the manufacturer of your ODBC driver. Your System Administrator can assist you in installing and configuring ODBC for use on your computer.
To Display Data from an ODBC Table
- Choose File>Open or click
 on the Standard toolbar, or right-click anywhere inside the Maptitude frame except on a window and choose Open. Maptitude displays the File Open dialog box.
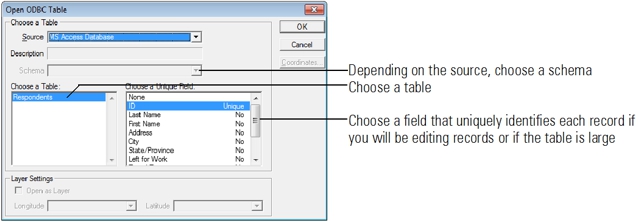
 - Choose ODBC Table from the Files of Type drop-down list. Maptitude displays the Open ODBC Table dialog box.
- Choose a source from the Source drop-down list. If the source is generic, such as MS Access, Maptitude will display the Select Database dialog box. Choose a database, and click OK.
- Make choices as follows:
- Click OK.
 |
NOTE: If your table contains coordinate information you can open an ODBC table as a layer. See Creating a Map Layer from an ODBC Table for more information. |
What happens next will depend upon the type of file you are opening and the ODBC driver you are using. Some products do not require a password or any supplemental information. In this case, Maptitude simply displays the data in a dataview. Other products require a password or other supplemental information. See your System Administrator about obtaining access. Once you have met the requirements of your data source, Maptitude displays the data in a dataview.
To edit data using ODBC, there must be a data field that contains a unique value for each record in the table. Choose this field from the Unique Field drop-down list. For example, if you open a customer file using ODBC, choose the Customer ID as the unique field. If you do not identify a unique field, the ODBC table will be read-only, and you will not be able to edit values in the table.
If a unique field is specified, it is used as a key field for finding records with the Edit-Find command. The field you choose should be indexed in the source table, or performance will be slow.
Once the dataview is displayed, you can use the dataview exactly like any other dataview. With the support for ODBC 3.0, you can add and delete records. Some databases, however, may have restrictions on editing or updating the data. Also, note that traffic on your local area network and the load on your file server may affect response time.
|
NOTE: If you use a generic ODBC source, you may be limited in what you can open with that source to just the tables in the database or the directory that you choose. To use multiple sources of the same database type, you can configure additional sources with the ODBC setup program. |
Creating a Dataview Using an ODBC SQL Query
You can use an SQL query to select data from an ODBC table to view in a dataview. An SQL query allows you to view all or some of the fields from one or more tables. An SQL query can specify such things as which records to select, what sort order to use, and how to group records.
Maptitude helps you build SQL queries by providing the names of tables within the ODBC source and of fields within a table, and providing keywords that can be used in an SQL query. Different drivers have different SQL capabilities, so an SQL statement that works with one ODBC driver may not work with another. Maptitude does not check the syntax of the Select statement. The following is a brief overview of building a Select statement.
The default query when you open the dialog box is “SELECT * FROM” You only need to add a table name. The asterisk in the SELECT section means to include all fields in the dataview; you can replace it with a list of fields. Fields and tables in lists must be separated by commas. Field and table names that have spaces or special characters must be surrounded by quotes. If you are using two or more tables with field names in common, put the table name and a period before the field name to specify which field you mean. For example:
• SELECT * FROM Customers
• SELECT ClientID, ‘Last Name’ FROM Clients
• SELECT Route.ID, Stop.ID FROM Route, Stop WHERE Route.ID=‘Route Number’
The WHERE keyword is for selecting records and for joining two or more tables, and must be followed by a condition. Here are some examples, with keywords that can be used in WHERE clauses:
| Example | Selects records... |
|---|---|
| WHERE Type = ‘Commercial’ | That have ‘Commercial’ in the Type field |
| WHERE ‘Sales’ BETWEEN 10000 AND 25000 | Sales field value between 10,000 and 25,000 |
| WHERE LastName LIKE ‘Cal%’ | That start with “Cal” in the LastName field |
| WHERE Customer.ID = Sales.CustID DISTINCT | Where the IDs match, but ignores additional matches into Sales table |
The ORDER BY keyword sorts the records on one or more fields.
The GROUP BY keyword lets you summarize records by the values in one or more fields. Use the function keywords in the field list in the SELECT section to get the desired summary values:
| Function | Description |
|---|---|
| SUM() | Totals a field for the group of records |
| AVG() | Gets the mean of the group of records |
| MIN() | Gets the lowest value in the group of records |
| MAX() | Gets the highest value in the group of records |
| COUNT() | Counts the number of records in the group |
A field name can appear more than once; for example “SELECT SUM(Sales), AVG(Sales) FROM Qtr4 GROUP BY State” would display the total and mean of the Sales field for each state. You can add the DISTINCT keyword before a field name when using COUNT() to count only unique values. The HAVING keyword is used with the GROUP BY keyword to only include groups that meet a condition; for example, “HAVING COUNT(*)>2” would make sure the groups have at least two records.
You can reuse previous queries, which Maptitude keeps track of until you exit the program. To reuse queries later, you can save the previous queries to a query file, and then load queries from one or more query files. A query file is a text file that saves the SQL Select statement and the name of the source for each previous query.
To Display Data from an ODBC SQL Query
- Choose File>Open, click on the Standard toolbar, or right-click anywhere inside the Maptitude frame except on a window and choose Open. Maptitude displays the File Open dialog box.
- Choose ODBC SQL Query from the Files of Type drop-down list. Maptitude displays the SQL Query dialog box.
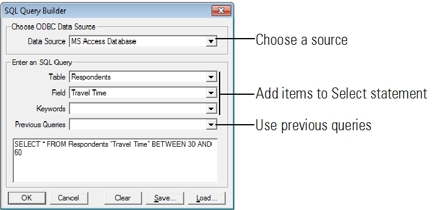
- Choose an ODBC data source from the Data Source drop-down list.
If the source is generic, such as MS Access, Maptitude will display the Select Database dialog box. Choose a database, and click OK.
- Make choices as follows to build the Select statement:
| To do this... | Do this... |
|---|---|
| Choose the fields to include | Replace the asterisk (*) in the Select statement with the names of one or more fields. |
| Add a field | Choose a field from the Field drop-down list. If you choose more than one field, separate the field names with commas. |
| Add a table | Choose a table from the Table drop-down list. If you choose more than one table, separate the table names with commas |
| Add a keyword | Choose the keyword from the Keywords drop-down list. |
| Use a previous SQL query | Choose a query from the Previous Queries drop-down list. If necessary, Maptitude will change the source, then will replace the Select statement with the chosen query. |
| Clear the Select statement | Click Clear. The Select statement returns to the default “SELECT * FROM” |
When adding items to the Select statement, make sure that the insertion bar is in the place where you want to make the addition, and that there will be spaces between words. You can save and load previous queries:
| To do this... | Do this... |
|---|---|
| Load previous SQL queries | Click Load to display the File Open dialog box. Choose a query file and click Open. The previous queries will be added to the Previous Queries drop-down list. You can load additional queries from other query files. |
| Save previous SQL queries | Click Save to display the Save As dialog box. Type a file name and click Save. Maptitude saves the queries that are in the Previous Queries drop-down list. |
- Click OK.
Maptitude opens a new dataview and displays the data requested in the Select statement.
Creating a Dataview from an Oracle Table
Maptitude provides direct access to data stored in Oracle tables. You can display and work with them within a dataview. The Oracle client software lets you set up Oracle services, which are like ODBC sources. An Oracle service gives you access to one or more Oracle tables.
If you want to be able to edit the data, the Oracle table will need to have a unique field. Having a unique field will also improve the performance for large tables. This field should be indexed. Maptitude will look for a key field in the Oracle table and, if found, suggest it as the unique field and show whether it is indexed and whether it is a primary key.
To Set Up Your Computer to Use Oracle Tables
First you must install and set up the Oracle client software. For installation instructions, refer to the documentation provided by Oracle. To configure an Oracle service, use Oracle client software and follow the directions provided by Oracle. Your System Administrator can assist you in installing and configuring Oracle for use on your computer.
To Display Data from an Oracle Table
- Choose File>Open, click on the Standard toolbar, or right-click anywhere inside the Maptitude frame except on a window and choose Open. Maptitude displays the File Open dialog box.
- Choose Oracle Table from the Files of Type drop-down list. Maptitude displays the Login Information dialog box.
- Make choices as follows:

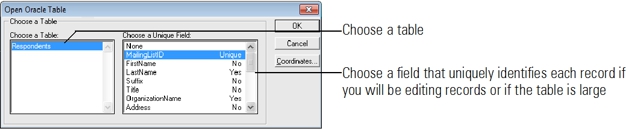
- Click OK. Maptitude connects to the Oracle service and displays the Open Oracle Table dialog box.
- Make choices as follows:
- Click OK.
Maptitude opens a new dataview and displays data from the Oracle table.
Creating a Dataview from a Microsoft Access Table
Maptitude provides direct access to data stored in tables in Microsoft Access files. You can display and work with a Microsoft Access table within a dataview. If you want to be able to edit the data, the Microsoft Access table will need to have a unique field. Having a unique field will also improve the performance for large tables. This field should be indexed. Maptitude will look for a key field in the Microsoft Access table and, if found, suggest it as the unique field.
Maptitude recognizes Microsoft Access files that contain Esri personal geodatabases, and displays a Confirm dialog box asking if you want to open a table as a map layer. Click No to open the table as a dataview, or Yes to open the table as a layer in a new map. For more information on opening a table as a map layer, see Creating a Map Layer from an Esri Personal Geodatabase.
To Display Data from a Microsoft Access Table
- Choose File>Open, click on the Standard toolbar, or right-click anywhere inside the Maptitude frame except on a window and choose Open. Maptitude displays the File Open dialog box.
- Choose MS Access Table from the Files of Type drop-down list.
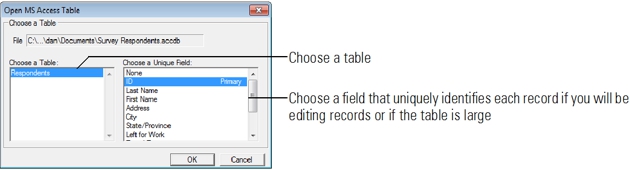
- Choose a Microsoft Access file and click Open. If Maptitude displays a Confirm dialog box, click No. Maptitude displays the Open MS Access Table dialog box.
- Make choices as follows:
- Click OK.
Maptitude opens a new dataview and displays data from the Microsoft Access table.
Creating a Dataview from a Microsoft SQL Server Table
Maptitude provides direct access to data stored in tables in Microsoft SQL Server databases. You can display and work with a Microsoft SQL Server table within a dataview.
If you want to be able to edit the data, the Microsoft SQL Server table will need to have a unique field. Having a unique field will also improve the performance for large tables. This field should be indexed. Maptitude will look for a key field in the Microsoft SQL Server table and, if found, suggest it as the unique field.
To Create a Dataview from a Microsoft SQL Server Table
- Choose File>Open, click on the Standard toolbar, or right-click anywhere inside the Maptitude frame except on a window and choose Open. Maptitude displays the File Open dialog box.
- Choose SQL Server Table as the file type. Maptitude displays the Connect to SQL Server dialog box.
- Type the server name in the Server Name edit box and choose Windows or SQL Server authentication from the Authentication drop-down list.
For SQL Server authentication, type your user name in the Login edit box and, if necessary, type your password in the Password edit box
- Click OK. Maptitude connects to the SQL Server service and displays the Open SQL Server Table dialog box.
- Choose a database from the Database drop-down list and choose a schema from the Schema drop-down list.
- Choose a table from the Choose a Table scroll list. Maptitude displays the fields that are in the table.
- Choose a field that uniquely identifies each record from the Choose a Unique Field scroll list.
- Click OK.
Maptitude opens a new dataview and displays data from the Microsoft SQL Server table.
Creating a Dataview from a PostgreSQL Server Table
Maptitude provides direct access to data stored in tables in PostgreSQL databases. You can display and work with a PostgreSQL table within a dataview.
If you want to be able to edit the data, the PostgreSQL table will need to have a unique field. Having a unique field will also improve the performance for large tables. This field should be indexed. Maptitude will look for a key field in the PostgreSQL table and, if found, suggest it as the unique field.
To Create a Dataview from a PostgreSQL Server Table
- Choose File>Open, click on the Standard toolbar, or right-click anywhere inside the Maptitude frame except on a window and choose Open. Maptitude displays the File Open dialog box.
- Choose PostgreSQL Table as the file type. Maptitude displays the Connect to PostgreSQL dialog box.
- Type the server name in the Server Name edit box, type your user name in the Login edit box and, if necessary, type your password in the Password edit box
- Click OK. Maptitude connects to the PostgreSQL service and displays the Open PostgreSQL Table dialog box.
- Choose a database from the Database drop-down list and choose a schema from the Schema drop-down list.
- Choose a table from the Choose a Table scroll list. Maptitude displays the fields that are in the table.
- Choose a field that uniquely identifies each record from the Choose a Unique Field scroll list.
- Click OK.
Maptitude opens a new dataview and displays data from the PostgreSQL table.
Creating a New Table from Scratch
To create a new table, you choose a format and then create a list of data fields, picking a field name, field type, and display width for each one. You can indicate which fields should have indexes so that sorting, searching, and selection can be performed quickly.
You can store several more values for a field for tables with dictionaries. These values are stored after the field description in the dictionary file:
- Default Value: when a new record is added, the field will be filled with this value
- Join/Split Methods: the update methods for a field when splitting or joining map features
- Display Name: the label to use in the column heading of the dataview, instead of the field name
You can set the default value and display name when you create a new table or modify an existing table. For more information on how to use display names, see Changing the Column Headings and Display Format. The join/split methods can be set when you are editing map features; they are stored for you in the dictionary file. See Updating Tabular Data.
Data Fields
Tables can contain the following types of fields:
| Type | Contents | Example |
|---|---|---|
| Integer | Whole numbers between -2,147,483,646 and 2,147,483,647 | 1, -400, 32000, 0 |
| Real Number | Numbers (with decimals) ranging from -1.7E+308 to 1.7E+308; the smallest absolute value being 2.3E-308 | -0.00001, 492452.4 |
| Character (String) | Letters, symbols, and numbers (up to 254 characters wide in dBASE and FoxPro) | "FY17.Q1", "New York" |
| Date/Time | Day, month, year, hour, minute, second compound variable | “1/1/2027 12:34:56AM” |
Date fields in dBASE tables and date/time fields in Excel, ODBC, Oracle, and SQL Server tables are read as date/time variables. Other formats, such as logical fields, are displayed as character (string) fields.
Fixed-format binary files can contain the following types of fields:
| Type | Contents |
|---|---|
| Real (8 bytes) | Numbers (with decimals) ranging from -1.7E+308 to 1.7E+308; the smallest absolute value being 2.3E-308 |
| Real (4 bytes) | Numbers (with decimals) ranging from -3.4E+38 to 3.4E+38; the smallest absolute value being 1.2E-38 |
| Integer (4 bytes) | Whole numbers between -2,147,483,646 and 2,147,483,647 |
| Integer (2 bytes) | Whole numbers between -32,766 and 32,767 |
| Integer (1 byte) | Whole numbers between 0 and 254 |
| Character (String) | Letters, symbols, and numbers |
| Date | Day, month, and year |
| Time | Hour, minute, and second |
| Date & Time | Day, month, year, hour, minute, and second |
Table Limits
Different table formats can hold different quantities of information. The table below summarizes the limits that apply to the different table formats:
Some programs cannot handle more than 255 fields in a dBASE file. FoxPro and dBASE limit the width of character fields to 254 characters and the length of numeric fields to 20 characters. Fixed-format binary tables limit their numeric field widths to 1-8 bytes, but allow arbitrary character field widths. Comma- or tab-separated text formats and fixed-format text files place no limits on field widths.
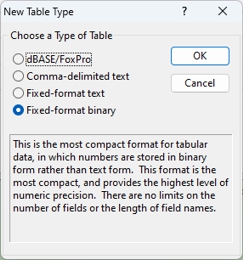
- Choose the type of table from the radio buttons.
- Click OK. Maptitude displays the New Table dialog box.
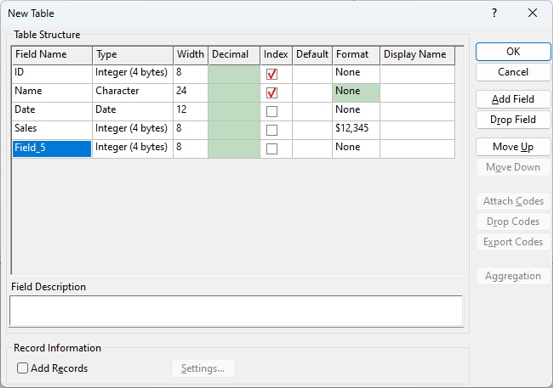
- Set up your new table according to the following instructions:
| To do this... | Do this... |
|---|---|
| Add a field | Click Add Field to add a new field to the list. |
| Delete a field | Click on any cell in the field you want to delete, then click Drop Field. |
| Change the field order | Click on any cell in a field, then click Move Up or Move Down. |
| Change a field name | Click on the cell in the Field Name column and type a new name. |
| Use a display name | Click on the cell in the Display Name column and type a display name. |
| Change a field type | Click on the cell in the Type column and choose a type from the drop-down list. |
| Change a field width | Click on the cell in the Width column and type a new width. |
| Change the number of decimals | Click on the cell in the Decimal column and type the number of decimal places. |
| Set a default value in new records | Click on the cell in the Default column and type a value in the Default box. |
| Change a field format | Click on the cell in the Format column and choose a format from the drop-down list. |
| Add new formats | Click on the cell in the Format column and choose “New Format” from the drop-down list to display the Custom Field Formats dialog box. For more information, see Creating Custom Field Formats. |
| Change a field description | Click on any cell in the field, then type a description in the Field Description box. |
| Index a field | Check the box in the Indexed column. |
- To automatically add records to the new table, check the Add Records box and choose an option from the radio list in the Add Records dialog box:
| Option... | What it means... |
|---|---|
| Fixed Number | Add a fixed number of records to the table |
| Matching Records | Add a record for every record in an existing dataview |
| Unique Value | Add a record for each unique value in a field in a dataview |
See “Adding Records to a New Table” below for more information on adding records.
Click OK to close the Add Records dialog box.
- Click OK to close the New Table dialog box. Maptitude displays the Save As dialog box.
- Type a file name, and click Save.
Maptitude creates the new table file, and adds new records according to your choices.
Adding Records to a New Table
When you create a new table, Maptitude can help you fill it with information. Maptitude offers three ways to do so: by adding a specified number of records, adding records that match those in an existing table, and adding records for each unique value of a field.
Adding a Fixed Number of Records
If you know how many records you want to store in the new table, you can tell Maptitude to add that number of blank records to the table.
For example, suppose you want to create a new table to hold information on ten different sales regions. Choose the Fixed Number option and enter 10 as the number of records, and Maptitude will create a table with ten empty records.
|
NOTE: You can always add records to a table or delete records from a table after it is created using the Edit>Add Records and Edit>Delete Records commands. |
Adding Matching Records
Use this option when you want to store additional columns of information about records or map features in a new table. The Matching Records option automatically adds one matching record for each record or feature in the original dataview.
For example, suppose you have a sales region layer that has columns containing sales by month for the current year. When next year comes around, you want to build a new table to store the monthly sales for that year.
To use this option, you must choose:
- The map layer or dataview for which you want to create matching records.
- Whether to create a new record for every record in the map layer or dataview or only for the records in a selection set.
- The field that identifies each record. Maptitude adds this field to the new table and fills it in with the correct values.
When you create the new table, Maptitude adds one record to the new table for each of the areas you specified. Instead of displaying the new table in its own dataview, Maptitude displays a joined view that shows the new and old data side by side.
Adding a Record for Each Unique Value of a Field
Use this option when you want to create a lookup table that adds new information to a map layer or dataview. Suppose you have a map layer of highways and know the classification of each one (Interstate, U.S. Route, State Route). You want to add average speed data, where you know that the average speed is different for each road classification. You can create a new table that will contain the average speed for each type of road, and join it to the original table.
To use this option, you must choose:
- The map layer or dataview you want to examine.
- The field whose values you want to use. Maptitude adds this field to the new table.
When you create the new table, Maptitude adds one record to the new table for each unique value of the field you specified. Instead of displaying the new table in its own dataview, Maptitude displays a joined view that shows the new and old data side by side.
Try It Yourself: Creating a Table
1. Choose File>Open Workspace or click on the Standard toolbar, then open the NewTable workspace in the Tutorial folder. Maptitude displays a map of Connecticut sales territories and a dataview with the associated data. You will create a new table with sales data for the territories.
2. Choose Dataview>Table>New. Maptitude displays the New Table Type dialog box.
3. Choose Fixed-format binary from the list of table types, then click OK. Maptitude displays the New Table dialog box.
4. Click Add Field.
5. Type Sales in the cell in the Field Name column.
6. Click on the cell in the Type column and choose Real (4 bytes) from the drop-down list.
7. Click on the cell in the Format column and choose $12,345.12 from the drop-down list.
8. Check the Add Records box. Maptitude displays the Add Records dialog box.
9. Click the Add Matching Records radio button. All of the settings are correct.
10. Click OK to close the Add Records dialog box, and click OK again to close the New Table dialog box. Maptitude creates a new table with one record for every sales territory, and displays a dataview of the new table joined to the sales territory data.
11. Click on a cell in the Sales field, type “1234.50” and press Enter. Maptitude stores that value in the new table.
12. Choose File>Close Workspace to close the workspace.
Modifying the Structure of a Table
As you combine your own data with Maptitude maps, you may find that you want to restructure your data tables to add information, speed up performance, and so on. You can easily do so using the powerful built-in Maptitude relational database management capabilities. For most table formats you can:
- Expand a table to hold more information by adding fields
- Change the order of fields
- Change the field names
- Change the type, width, number of decimals, and format for any field
- Add or remove indexes for any field
- Change the description of each field
- Indicate how data should be aggregated
- Attach or drop lookup codes
The Dataview>Table>Modify command can also be used to change the structure of a table in a geographic file. For example, you can use this command to add fields to a ZIP Code layer, or to reorganize the fields in a State layer. When you modify a table, Maptitude preserves the data that are currently stored in the table.
Changing the type of a field can affect your data. The following table shows what happens when you change a field from one type to another:
| Convert from... | To... | Here's what happens... |
|---|---|---|
| Real number | Integer | The number is truncated to the decimal point (for example, 11.7 is changed to 11) |
| Integer | Real number | No change |
| Character (String) | Integer or real | Alphabetic characters are lost, and leading numeric characters are converted to numbers (for example, "123A" is changed to 123 and "A123" is changed to 0) |
| Integer or real | Character | The numbers are converted into characters that look just like the numbers (for example, 1.25 is changed to “1.25”) |
You cannot modify a table while the table is part of a joined view.
To Modify the Structure of a Table
- Choose Dataview>Table>Modify or click
 on the Standard toolbar to display the Modify Table dialog box.
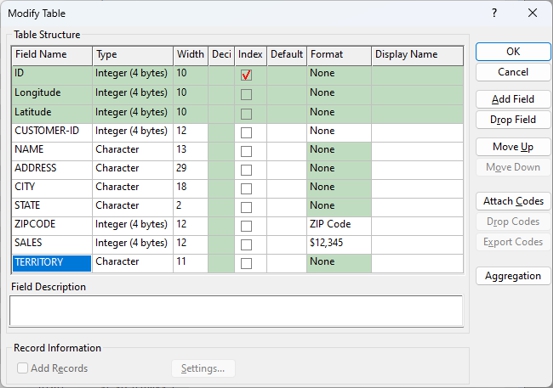
- Make the changes you want according to the following instructions:
| To do this... | Do this... |
|---|---|
| Add a field | Click Add Field to add a new field to the list. |
| Delete a field | Click on any cell in the field you want to delete, then click Drop Field. |
| Change the order | Click on any cell in a field, then click Move Up or Move Down. |
| Change a display name | Click on the cell in the Display Name column and type a display name. |
| Change a field name | Click on the cell in the Field Name column and type a new name. |
| Change a field type | Click on the cell in the Type column and choose a type from the drop-down list. |
| Change a field width | Click on the cell in the Width column and type a new width. |
| Change the number of decimals | Click on the cell in the Decimal column and type the number of decimal places. |
| Change the default value for new records | Click on the cell in the Default column and type a value in the Default box. |
| Change a field format | Click on the cell in the Format column and choose a format from the drop-down list. |
| Add new formats | Click on the cell in the Format column and choose “New Format” from the drop-down list to display the Custom Field Formats dialog box. For more information, see Creating Custom Field Formats. |
| Change a field description | Click on any cell in the field, then type a description in the Field Description box. |
| Index a field | Check the box in the Indexed column. |
| Change the aggregation method | Click Aggregation to display the Default Aggregation dialog box. See Aggregation Methods for more information. |
Note that the Field Display settings are disabled if you are using a dBASE file. Also, you cannot change the aggregation method or set default values or the display name for dBASE or comma- or tab-separated text files.
- Click OK. Maptitude displays the Confirm dialog box.
- Click Yes to save the modifications.
Maptitude modifies the table as you requested.
Working with Codes
Often a database will contain shorthand codes that have a particular meaning. Using codes saves space because long character strings are replaced with shorter codes. For example, look at the table shown below, which contains information on transit segments:
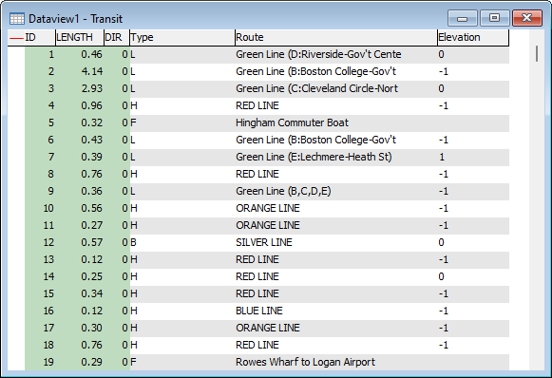
Several of the fields use codes to indicate something about each segment. For example, in the Type field, a code of “L” indicates that the segment is an light rail and a code of “F” indicates a ferry. An Elevation code of -1 indicates that it is below grade, while an Elevation code of 0 indicates that it is at grade.
Maptitude can automatically replace these shorthand codes with more accurate, descriptive text, as shown in the dataview below. Fields with a coded value include a 6symbol.
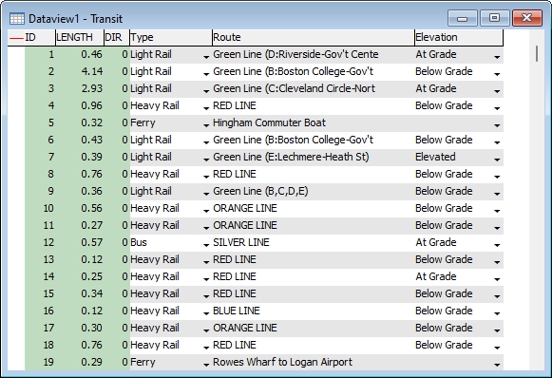
To replace shorthand codes with descriptive text, you create a lookup table and attach it to the original table. A lookup table is simply a table that contains the field names, the shorthand codes, and the descriptive text you want to see displayed. The lookup table that follows contains all the information for the highway example above:
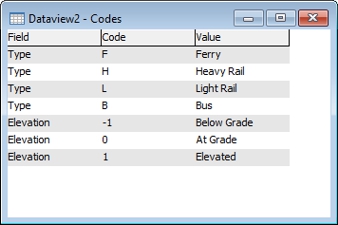
The lookup table must contain the following three fields:
| Field | What it contains |
|---|---|
| Field | A text field that contains the name of the field to which this code applies |
| Code | A text or numeric field that contains the codes that are used in the table |
| Value | A text field that contains the descriptive text you want to see displayed in place of the code |
While the field names do not need to match the ones shown above, using these names makes it simpler to attach the lookup table. When you attach the lookup table, Maptitude stores the codes and descriptive text in a file with the same name as the table to which they are attached, with the following extensions:
| File type | Lookup table file extension |
|---|---|
| dBASE | .dxl |
| FoxPro | .dxl |
| Fixed-format text | .axl |
| Fixed-format binary | .bxl |
| Comma- or tab-separated text | .cxl |
You can choose to attach all the records in the lookup table, or only the records in a particular selection set.
Once the codes are attached, you do not need to save the original lookup table. If some codes are missing from the lookup table, Maptitude will simply display the shorthand code, without any descriptive text. To help you build a lookup table with a record for each unique value of a field, see Adding a Record for Each Unique Value of a Field.
- Make sure both the table containing the shorthand codes and the lookup table are open and displayed in a dataview.
- Make the table containing the shorthand codes the active window.
- Choose Dataview>Table>Modify or click on the Standard toolbar to display the Modify Table dialog box.
- Click Attach Codes to display the Attach Codes dialog box.
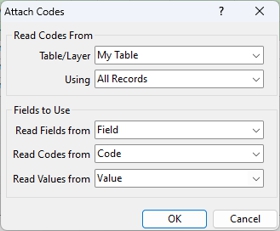
- Choose the table or layer to attach the codes to from the Table/Layer drop-down list.
- Choose whether to use all records or a selection set from the Using drop-down list.
- In the Fields to Use frame, choose the fields containing the code information from the three drop-down lists.
- Click OK. Maptitude permanently attaches the codes and displays a Note dialog box.
- Click OK to close the Note dialog box.
Note that although Maptitude returns you to the Modify Table dialog box where you can continue to make changes, the Cancel button will not affect the attached codes.
- Click on a coded field cell (shown with a 6symbol) to highlight it, then double-click on the cell. Maptitude displays a drop-down list with the descriptive text for the codes for that field.
- Choose an item from the drop-down list.
Maptitude updates the code stored in the cell and displays its descriptive text.
- Choose Dataview>Table>Modify or click on the Standard toolbar to display the Modify Table dialog box.
- Click Drop Codes. Maptitude displays the Confirm dialog box.
- Click Yes.
Maptitude stops using the lookup table. Note that although Maptitude returns you to the Modify Table dialog box where you can continue to make changes, the Cancel button will not affect the removed codes.
To Create a Lookup Table from a Dataview
- Choose Dataview>Table>Modify or click on the Standard toolbar to display the Modify Table dialog box.
- Click Export Codes. Maptitude displays the Save As dialog box.
- Type a file name for the new table and click Save.
Maptitude creates a lookup table. To display it in a dataview, complete the changes to your table and click OK to close the Modify Table dialog box, then use the File>Open command to open the new table.
Creating a Table from a Dataview
You can create a new table, in any of the formats that Maptitude supports, from the data displayed in a Maptitude dataview. When you save a dataview as a new table, the new table file stores the dataview rows in their screen order and converts any formula fields to stored data. When the dataview you save is a joined view, Maptitude writes the information from all its different sources into a single, new table file. Displaying this new table is much faster than viewing the original joined view.
When you save data in a dataview to a new table, you can choose fields to be permanently indexed in the new table. To do so, you highlight the columns in your dataview that contain the data fields you want indexed before you save the data to a new table file.
When you create a table from a dataview, Maptitude uses the widths of each column to determine the size of each field in the table.
To Create a New Table from a Dataview
- Click on the dataview you want to save as a new table.
- Select any columns you want to index, as described below:
| To do this... | Do this... |
|---|---|
| Select a single column | Click on the column heading (the name of the field at the top of the column). |
| Select an additional column | Hold down the Shift key and click on the column heading. |
| Remove a column from the selection | Hold down the Ctrl key and click on the column heading. |
- Choose File>Export>Table to display the Save As dialog box.
- Choose the type of table you want to create from the drop-down list.
Depending on the table format you choose there may be additional export options. Click Options, make choices from the available options, and click OK.
- Enter a name for the file.
- Click Save.
Maptitude creates a new table with indexes on any fields that you highlighted in step 2, and writes all the information from the dataview to the file. To use the new table, open it with the File>Open command.
Creating and Using Field Sets
You can define groups of fields in a table for display in field sets. Field sets are available in dataviews, Edit Attributes windows, and Info windows for Caliper compact (.CDF) and standard (.DBD) geographic file layers. With field sets you can very quickly focus on certain fields and hide the rest of the fields. This can make data entry easier, because you can choose which fields are shown, and in which order. For example, if you are only interested in housing unit value, you could create a field set with the value fields when you use the Info tool:
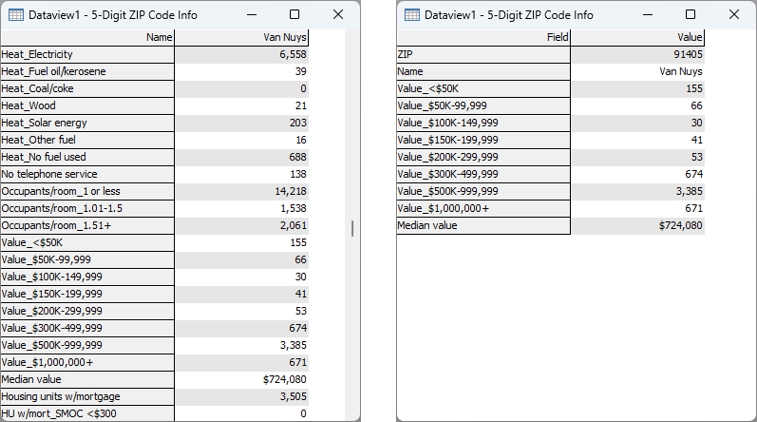
An Info window for a ZIP Code with every field (left) and a field set of just the housing value fields (right)
You can create any number of field sets, modify the fields in a field set, and delete field sets. The All Layer Fields set, which contains all of the fields in their natural order, is automatically created and cannot be deleted or modified. If the dataview is a joined view, only the fields in the table for the layer are displayed when you choose the All Layer Fields set.
Field sets are saved with the geographic file, in a file with the same file name and the extension .RFS for standard (.DBD) geographic files or .CFS for compact (.CDF) geographic files. Each geographic file can have its own field sets, including the line and node tables for a line geographic file.
 |
Field sets cannot be created on CDF layers that are read-only. |
To Manage Field Sets
- Choose Dataview>Fields>Show/Hide Manager or right-click in a dataview and choose Show/Hide Manager to display the Show/Hide Fields Manager dialog box.
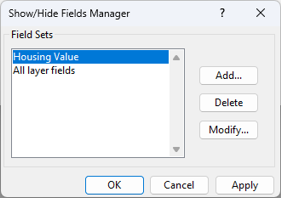
- Make choices as follows:
- Click OK.
Maptitude updates the field sets, and shows the highlighted field in the dataview.
Computing Statistics
The Dataview>Statistics>Summary command computes summary statistics for the records in a dataview. For each numeric field in the dataview, Maptitude finds:
- The number of records with a value for the field
- The sum of all the values
- The minimum and maximum values
- The mean and standard deviation
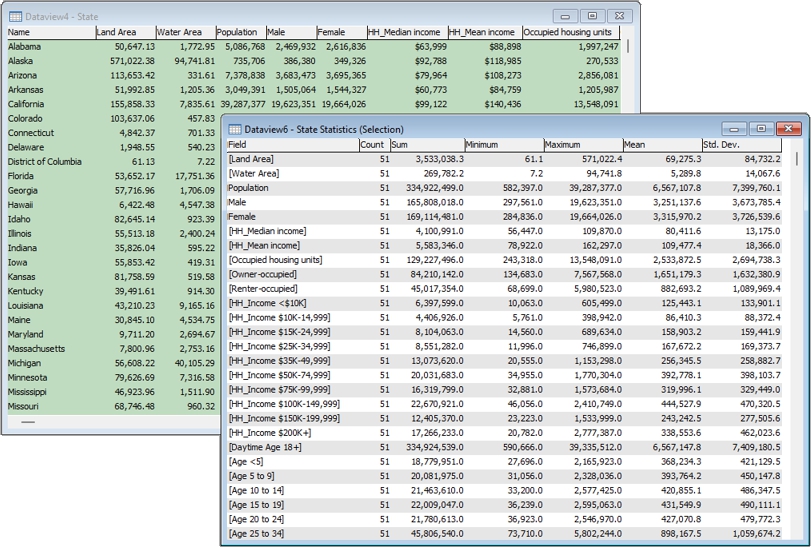
The statistics are computed for all the records that are shown in the dataview. This means you can compute statistics for all the records in a table or map layer, or just for the records in a selection set. See Showing Selection Sets in a Dataview to learn how to choose the records that are shown in a dataview.
- Choose All Records or a selection set from the drop-down list on the Standard toolbar.
- Choose Dataview>Statistics>Summary or click
 on the Standard toolbar.
Maptitude computes the statistics and displays the results in a new dataview. If you want to save the statistics, see To Save a Dataview With a New Name or as a Different File Type.
Computing Spatial Autocorrelation
When dealing with an area layer, you may want to see how certain characteristics of each area are distributed over the whole layer. For example, we might want to ask how spread out the income distribution is for a state by examining where the areas of high income are and how crowded together these areas are. One analytical tool helpful to achieve this goal is Spatial Autocorrelation. This is a measure of how likely two neighboring areas are to have similar values for a specific field. For instance, if we were looking at housing prices across ZIP Codes, we would expect to see strong positive autocorrelation, since ZIP codes with high House values tend to be close together. Zero autocorrelation simply means that the value for that field is not affected by the values for the areas around it. Negative autocorrelation is quite rare in practice, but can be visualized by thinking of a chessboard – each square surrounded by neighbors of a different color.
Maptitude allows you to quickly generate the Moran’s I statistic – a statistic that varies between -1 and 1. Values close to 1 represent strong positive autocorrelation, values close to zero represent no autocorrelation and values close to -1 represent negative autocorrelation.
To compute spatial autocorrelation you select the records in the area layer to consider and choose the field in the area layer that contains the values for which you are interested in analyzing the autocorrelation.
The spatial autocorrelation analysis creates a dataview with the following information:
- Observations: Number of areas examined
- S1, S2, and Sum of Weights: Key calculated values used in the formula for Moran’s I
- Moran’s I
- Expected value of Moran’s I if no autocorrelation is present
- Standard Error of the Moran’s I statistic
- Z Score and P value for the test against no autocorrelation
- A 95% Confidence interval for the true value of the Moran’s I statistic
You also have the option of creating a summary report of the analysis that includes the Field analyzed, the number of observations, the result of the analysis, and a conclusion drawn from the analysis.
To Compute Spatial Autocorrelation
- Make an area layer the working layer in your map and use one of the selection methods to select the areas you want to study. For more information on creating selection sets, see Filters, Queries, and Selection Sets.
- Choose Dataview>Statistics>Spatial Autocorrelation to display the Spatial Autocorrelation dialog box
- Choose whether to use All Features or a selection set from the Use drop-down list.
- Choose the field for which to calculate the autocorrelation from the Field drop-down list.
- Check Treat missing values as zeros to treat missing values as zero or uncheck to omit features with missing values from the analysis.
- Check Create report to create a PDF report summarizing the analysis.
- Click OK.
Maptitude computes the Moran’s I statistic for the chosen field based on the chosen area features and displays a dataview with the results. If you chose to create a report, Maptitude launches your default PDF application and displays the report.
Estimating and Evaluating Models
Maptitude has two commands for estimating and evaluating models:
- Dataview>Statistics>Model Estimation estimates a model on any map layer or dataview by defining the dependent variable, one or more independent variables, and the set of records on which the model should be estimated.
- Dataview>Statistics>Model Evaluation evaluates a model on any map layer or dataview by filling a field with the predicted dependent variable
Estimating a Model
To estimate a model, you choose the dependent variable, one or more independent variables, and the set of records on which the model should be estimated. You can use Regression or Binary Logit as the method.
Models can be estimated on any map layer or dataview. You can choose to estimate the model parameters using all of the records in the layer or dataview, or only those records in a selection set. You can select the records using any of the selection commands and tools, as described in Queries and Selection Sets.
The model estimation procedure produces two output files: a formatted report of the estimation results including all goodness-of-fit and importance measures, and a file containing the values of the estimated model parameters. The model parameter file can be used to evaluate the model for other sets of data, as described in Evaluating a Model.
To Estimate a Model File
- Choose the layer or dataview you want to use by choosing the layer from the drop-down list on the Standard toolbar or by clicking in the dataview window.
- Choose Dataview>Statistics>Model Estimation to display the Model Estimation dialog box.
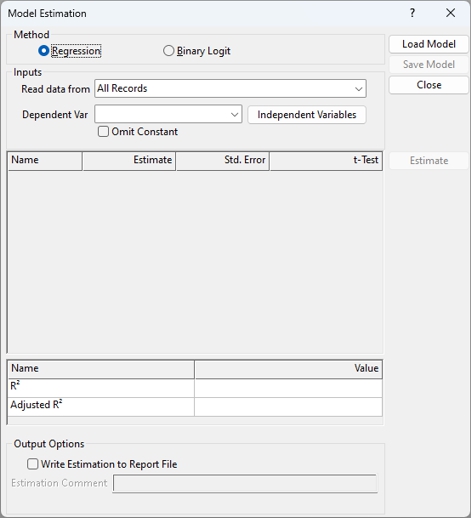
- If you have an existing model, click Load Model to display the Open Model File dialog box, choose the model file, and click Open.
- Choose the type of model from the Method radio list.
- Choose the records to use from the Read Data From drop-down list.
- Choose the dependent variable from the Dependent Var drop-down list.
- Click the Independent Variables button to display the Choose Independent Variable Fields dialog box.
- Choose the independent variables as follows:
| To do this... | Do this... |
|---|---|
| Add a field | Choose one or more fields from the Available Fields list and click Add>> |
| Drop a field | Choose one or more fields from the Estimation Fields list and click <<Drop |
| Drop all fields | Click Clear |
Click OK when you are done.
- Make choices as follows:
| To do this... | Do this... |
|---|---|
| Omit the constant from the model | Choose one or more fields from the Available Fields list and click Add>> |
| Write the estimation to a report file | Check Write Estimation to Report File; you can enter a comment in the Estimation Comment edit box |
- Click Estimate. Maptitude estimates the model.
If you checked Write Estimation to Report File, Maptitude displays the Results Summary dialog box.
| To do this... | Do this... |
|---|---|
| View any warnings | Click Show Warnings to display any warnings with your browser program |
| View the report | Click Show Report to display the report with your browser program |
| Close the dialog box | Click Close |
- Click Save model to display the Save Model As dialog box, type a file name for the model, and click Save. Maptitude saves the model.
- To change the model, return to Step 4. When you are done, click Close.
Maptitude closes the Model Estimation dialog box.
Evaluating a Model
The model estimation command produces a text file with information that can be used to evaluate the model on a data set having similar fields. To use the evaluation procedure, you choose the subset of records to be evaluated and the field that will receive the predicted dependent variable. You can also choose the fields that contain the values of the independent variables, and make adjustments to the model parameters. The procedure will calculate the new value based on the model type and the parameters stored in the model file, and will fill in the designated field.
To Evaluate a Model
- Click in the dataview you want to use to apply the model.
- Choose Dataview>Statistics>Model Evaluation to display the Open Model File dialog box.
- Choose the file containing the model you want to evaluate and click Open. Maptitude displays the Model Evaluation dialog box.
- Make choices as follows:
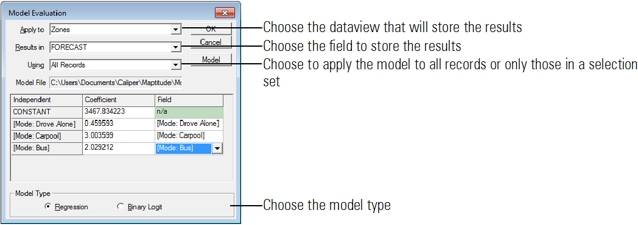
- Choose the fields containing the values of the independent variables from the drop-down lists in the Field column.
- Adjust the model parameters by entering a new coefficient in the cell in the Coefficient column.
- Click OK.
Maptitude evaluates the model and stores the results in the selected field.
©2026 Caliper Corporation