Maptitude Help / Working with Tables, Databases, & Charts
Working with Tables, Databases, & Charts
Maptitude makes maps using data stored in geographic files, databases, and spreadsheets, including Oracle Spatial, Microsoft Access and Microsoft Excel.
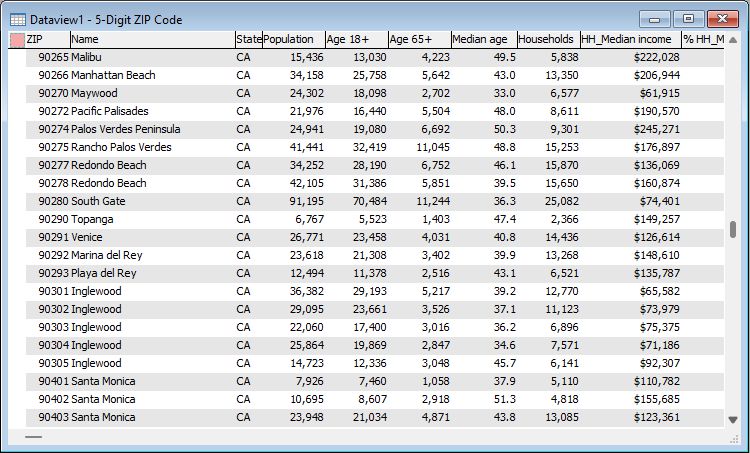
When you are working with a map you can see the data associated with map features by using the Info or Hover tools. Alternatively, you can display the data in tabular form, using dataviews. Dataviews let you arrange the columns and rows of information any way you like and customize the appearance of the data. You can also edit data in dataviews, create formula fields to display calculated values, and compute statistics for records shown in a dataview.
 |
For a video tutorial see: (Internet connection required) • Working with Data in Maptitude: Using the Info tool, displaying data in a dataview, and working with dataviews (locking columns, sorting, formula fields, and formatting) |
Topics in this section:
- Displaying Data for Map Features
- Displaying Data for a Map Layer or a Table
- Working with Dataviews
- Doing Calculations with Data
- Editing and Updating Data
- Dataview Tools
- Saving Dataviews
- Printing a Dataview
- Creating and Working with Box Plots
- Creating Scatter Plots
- Creating and Working with Charts
- Dataview Advanced Topics
©2026 Caliper Corporation