Maptitude Help / Working with Tables, Databases, & Charts / Editing and Updating Data
Editing and Updating Data
When you change a value in a dataview, the change is stored immediately in the geographic file or database. You do not need to save the dataview to save changes to your data.
Maptitude lets you edit data in several different ways:
- Edit the data directly in a dataview
- Copy and Paste cells in a dataview
- Fill a range of cells or a column using commands
- Clear a range of cells or a column
- Add and Delete Records
- Use dataview tools to transpose or merge the records in the table
There are some cases where you cannot edit the data you see in a dataview. For example, you cannot edit data if you check Read Only when you open a file, if the data are in an Excel worksheet or a comma- or tab-separated text file, or if the data are stored in a protected file or folder on a network. Data that cannot be changed are shaded in green in the dataview.
Maptitude allows many users to share data on a computer network. This arrangement means that any change you make to data stored on a file server is immediately available to all users. The reverse is also true — if someone else changes a value in a file stored on a file server, the data is immediately available to your maps, dataviews, and formula fields. While the data are updated immediately, the change may not be visible until the next time your dataview or map is drawn on the screen. Use the Window>Refresh command to update a map or dataview.
You also can control how files are shared. When you open a table, you have the option to make it available for your exclusive use. The table cannot be accessed or edited by other users when you exclusively open it. You can change the default sharing settings by choosing Edit>Preferences command and going to the File Sharing tab.
When creating shared file-based temporary indices when two users are sharing a file with write access, the default is to create these files in the new format. Since this means the indices cannot be read by users with older versions of Maptitude, you can choose Edit>Preferences, click the File Sharing tab of the dialog, and check Use Old-Format Shared Temporary Indices to use only the older format.
You can also use the Edit>Preferences command to set the shared directories for ODBC tables. Maptitude uses the native ODBC indices when you are working with the whole table, but uses internal indices with selection sets. By setting the shared directory, these indices will be updated correctly if other users modify the data. For more information, see Sharing Maptitude Data Files.
If necessary, you can also undo and redo dataview edits.
Editing Data in a Dataview
You edit data in a dataview just the way you would expect — by clicking on a cell and typing a new value or by double-clicking on a cell and editing the current contents.
 To Edit Data in a Dataview
- Click on the cell containing the data you want to edit.
- Type a new value.
- Press Enter.
— OR —
- Double-click on the cell containing the data you want to edit.
- Make changes to the current value.
- Press Enter.
— OR —
- Click on the cell containing the data you want to edit and press F2. Maptitude activates the cell for editing at the end of the text.
- Make changes to the current value.
- Press Enter.
Note that if you change data that is used in a map for a theme or for labels, you will need to choose Window>Refresh in order to see the changes on the map. Selection sets are not updated when you edit the data upon which they are based.
Copying and Pasting Cells in a Dataview
With the Edit>Copy command you can save highlighted cells in a dataview window (including an Info window) to the Windows clipboard. You can then paste the data into other Windows programs, or use the Edit>Paste command to paste the data into a Maptitude dataview. In a text-handling program such as Microsoft Word, there will be one row of data for each row of cells in the highlighted area, and the data in a row will be separated by tabs. In a table-handling program such as Microsoft Excel, the data will go into separate cells in the table.
With the Edit>Paste command you can paste data from the Windows clipboard into one or more highlighted cells. If you highlight one cell, you can paste data into one cell or a range of cells to the right and/or below the one cell. If you highlight a range of cells, the range must be the same size as the data in the Windows clipboard.
- Highlight one or more cells in the dataview.
- Choose Edit>Copy or right-click the mouse and choose Copy.
 |
TIP: You can use the copy shortcut (Ctrl+C) to copy cell values. |
Maptitude copies the data in the highlighted cells. You can paste the data into other Windows programs.
- Highlight one or more cells in the dataview.
- Choose Edit>Paste or right-click the mouse and choose Paste.
|
TIP: You can use the paste shortcut (Ctrl-V) to edit cell values with data that has been copied. |
Maptitude pastes the data from the Windows clipboard into the highlighted cells. If you highlight a range of cells, the range must be the same size as the data in the Windows clipboard.
Filling a Range of Cells or Groups of Columns with Data
Maptitude lets you fill a range of cells or one or more columns of a dataview with data by using the Edit>Fill command. There are several methods for filling data:
Single Value: You can fill a column or range of cells with a single constant value. If the fields are set up to hold only numeric data, you must fill them with a number.
Sequence of Numbers: You can fill a column or range of cells with a sequence of numbers, with any starting number and increment you want. Maptitude fills in the first cell with the starting number, and then adds the increment before filling in the next cell. Most often, you start with 1 and use an increment of 1. If the selected range of cells includes more than one column, the cells are filled left to right and then down, except if you select the right-hand column first, then the cells are filled right to left and then down.
Formula: You can store the result of a formula. You can add, subtract, multiply, or divide other data. Formulas can contain field names; arithmetic operators like +,-, *, and /; relational operators like <, >, <=, >=, and <>; and many different types of numeric and string functions. When you store the results of a formula, the range you select must be entirely within a single column of the dataview. For more information on formulas see Doing Calculations with Data and Formulas, Conditions, and Functions.
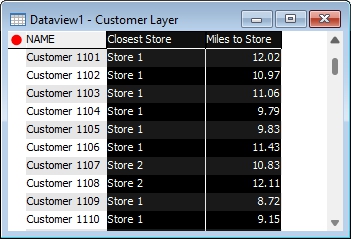
Tag: If the dataview contains data for features in a map, you can fill in a column with the name of the nearest feature in another map layer or with the distance to the nearest feature in another map layer. This is called tagging. For example, suppose you are looking at a dataview of your customers. You could fill in one column in the dataview with the distance to the nearest store and a second column with the name or address of the nearest store:
How a layer is tagged depends on the type of layer. The following table explains how different types of layers are tagged:
| Layer to be tagged (Destination) |
Tagging from a point | Tagging from a line | Tagging from an area enclosing | tagging from an area nearest edge |
|---|---|---|---|---|
| Point | Closest point | Closest line | Area that the point is in | Area edge that the point is closest to |
| Line | Point that is closest to the line | Line that is closest to a shape point on the line | Area that the midpoint of the line is in | Area edge that the midpoint is closest to |
| Area | Point that is closest to the area centroid | Line that is closest to the area centroid | Area that the centroid of the area is in | Area edge that the centroid of the area is closest to |
To use the tag method, you must choose to fill a single column in the dataview, and the field type must match the type of data you are filling in.
To use "Area Nearest Edge" as the "Layer tagged from (Source)", you must choose "Tag with nearest area by edge." Otherwise, the default is "Area Enclosing."
"Area Nearest Edge" is useful for point-not-in-polygon operations because it allows tagging of those points with the nearest area or with the distance to the nearest boundary. For example, you may want to assign prospects that are not within any of your sales representative's service areas to the nearest territory so as to include them in your analysis. Or you may want to know from a point layer of sales observations how far each of them is from your market area boundary to explore competition and reach.
Aggregate: You can fill in records with the aggregate data from another layer. For example, you could fill in fields for a city boundary layer with the total count of customers or the total street mileage:
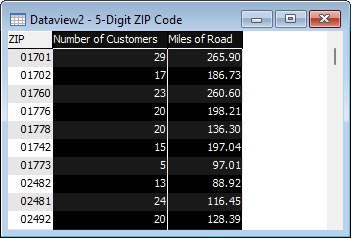
You can use this only if the dataview contains data for a map layer. To use this method, you must choose to fill a single column in the dataview.
Clear: You can clear the values in a column or range of cells.
|
TIP: You may want to create a new blank field to fill with data. To create a new field you must modify the underlying table. See Modifying the Structure of a Table. |
To Fill a Range of Cells or a Column with Data
- Highlight the range to fill by dragging a rectangle over the cells, by clicking in one corner of the range and shift-clicking in the other corner, or by clicking on the name of a field to select a column and shift-clicking to select more columns.
- Choose Edit>Fill or right-click on a column heading or range and choose Fill. Maptitude displays the Fill dialog box.
- Choose a method and make changes as follows:
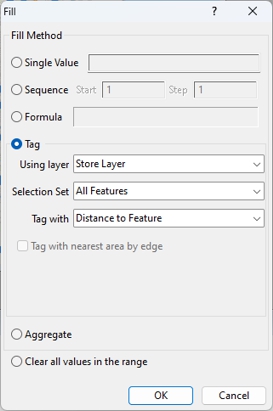
| Fill Method | How it works... |
|---|---|
| Single Value | Enter a value to fill the cells you chose in step 1 with the same value |
| Sequence | Enter a start value and a step increment to fill the cells you chose in step 1 with a sequence |
| Formula | Displays the Formula dialog box where you can fill the cells you chose in step 1 with the results of a formula based on other fields; For more information on formulas see Doing Calculations with Data |
| Tag | Fills the cells you chose in step 1 with the name, ID, or other field of your choice, or the distance to, the nearest feature in another layer |
| Aggregate | See To Fill a Field with Aggregate Data |
| Clear all values in the range | Clears any values from the cells you chose in step 1 |
|
TIP: You can also clear cells by right-clicking on a highlighted range of cells and choosing Clear. |
- Click OK.
Maptitude fills the highlighted columns or range of cells with data.
 |
For a video tutorial see: (Internet connection required) |
To Fill a Field with Aggregate Data
- Select the field to fill by clicking on the name of the field.
- Choose Edit>Fill or right-click on a column heading or range and choose Fill. Maptitude displays the Fill dialog box.
- Click the Aggregate radio button. Maptitude displays the Aggregate Data dialog box.
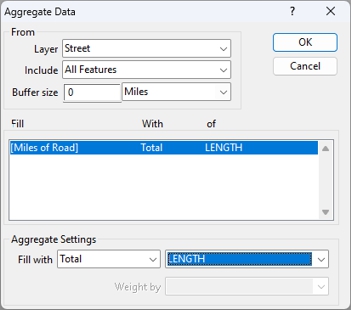
- Choose the layer from which to aggregate from the Layer drop-down list.
- Choose whether to aggregate from all features in the layer or a selection set from the Include drop-down list.
- If you are working with a point or line layer, enter a buffer size and units.
- In the Aggregate Settings section, choose an aggregation method from the Fill with drop-down list and the field that contains the data to aggregate from the second drop-down list.
| Method | What it does |
|---|---|
| Total | Maptitude sums the values in the chosen field for all of the individual features that are within the area specified. |
| Average of | Maptitude computes the average of the values in the chosen field from the individual features, or a weighted average if you specify a field in the Weight by drop-down list. |
| Low Value of | Maptitude uses the lowest value in the chosen field from among all of the individual features. |
| High Value of | Maptitude uses the highest value in the chosen field from among all of the individual features. |
| Count | Maptitude counts the number of individual features. |
- Click OK to return to the Fill dialog box.
- Click OK.
Maptitude fills the highlighted column with the aggregate data.
Adding and Deleting Records
You can use a dataview to add records to or delete records from a table or from a standard (.DBD) point geographic file. When you add point features to a geographic file from a dataview, the longitude and latitude of the point are left blank. You can then type in a longitude and latitude, or use one of the locate commands to fill in the correct location. For more information, see Geocoding: Locating Your Data on a Map. You can also use the geographic editing tools to add point features as described in Creating and Editing Geographic Files.
You cannot add line or area features to a geographic file from a dataview. Instead, you must use the geographic editing tools, which are described in Creating and Editing Geographic Files.
- Click
 on the Standard toolbar.
Maptitude adds a record to the file, and highlights it in the dataview.
- Choose Edit>Add Records to display the Add Records dialog box.
- Type the number of records to add and click OK.
Maptitude adds the records to the file.
- Click on any cell in a record you want to delete or click and drag to highlight several records.
- Choose Edit>Delete Records or click
 on the Standard toolbar and click Yes to confirm that you want to delete the records.
—OR—
- Click on a locked cell to select an entire row, and shift-click to select more rows.
- Right-click on a locked cell, choose Delete Records, and click Yes to confirm that you want to delete the records.
You can delete a group of records at once by selecting them. When you use this method, the records you delete must be in the selection set named “Selection.” Select the records you want to delete using one of the selection commands or tools.
Maptitude deletes the records. For more information on Selection Sets, see Queries and Selection Sets.
Undoing and Redoing Dataview Edits
You can undo and redo edits in a dataview, including an Info window. Maptitude lets you undo dataview edits using the Edit>Undo data editing command or the Undo  button on the Standard toolbar. You can also redo the most recently undone dataview edits using the Edit>Redo data editing command or the Redo
  button on the Standard toolbar.
 |
NOTE: You can undo and redo dataview edits provided that you have enabled the Undo/Redo option. Choose Edit>Preferences and check the Remember Edit Actions box and set the maximum undo file size on the System Page to enable this option. |
When you undo or redo a dataview edit, Maptitude displays a dialog box with a description of what type of dataview edit will be undone or redone.
You can also undo and redo edits done with the Edit>Fill and other commands. The names of the Undo and Redo commands on the Edit menu will reflect the edit actions that can be undone and redone, such as Edit>Undo Add Record or Edit>Redo Delete Record.
There is one series of edit actions, including geographic edits, which can be undone and redone in order. If you are doing a complex series of edits in different windows, the next action that can be undone or redone may be in a different window. If necessary, Maptitude will change the current window and the location within that window to show the modification caused by undoing or redoing.
To Undo Dataview Edits
- Choose Edit>Undo [edit action], click on the Standard toolbar, or use the shortcut Ctrl+Z. Maptitude displays a Confirm dialog box with a description of the edit action that will be undone.
- Click Yes.
Maptitude undoes the most recent edit action.
To Redo Dataview Edits
- Choose Edit>Redo [edit action], click on the Standard toolbar, or use the shortcut Ctrl+Y. Maptitude displays a Confirm dialog box with a description of the edit action that will be redone.
- Click Yes.
Maptitude redoes the most recently undone edit action.
Try It Yourself: Editing Data in a Dataview
1. Choose File>Open Workspace or click  on the Standard toolbar, then open the EditData workspace in the Tutorial folder.
2. Click on any cell in the [ZIP Code] column of the School dataview, type 10001, and press Enter.
3. Click and drag to highlight several cells in the ZIP Code column.
4. Choose Edit>Fill, then click the Sequence radio button. Type 10001 for the start value, type 2 for the step value, and click OK. Maptitude fills the ZIP Code cells in the sequence 10001, 10003, 10005, etc.
5. Click on the ZIP Code heading to highlight the entire column.
6. Choose Edit>Fill and choose the Tag radio button. Choose 5-Digit ZIP Code from the Using Layer drop down list, choose ZIP from the Tag With drop-down list, and click OK. Maptitude fills the ZIP Code cells with the ZIP Code in which each school is located.
7. Click on the map or choose Window>Map1-Manhattan Schools to make the map the active window.
8. Click  in the Standard toolbar to activate the Info tool and click on several schools on the map. Notice that the ZIP Codes have been correctly tagged to the schools.
9. Click on the dataview or choose Window>Dataview1-School to make the dataview the active window again. The ZIP Code field should still be highlighted.
10. Choose Edit>Fill again, choose the Clear all values in the range radio button, and click OK. The ZIP Code column now has missing values.
11. Choose Edit>Undo Data Editing or click on the Standard toolbar, and click Yes in the Confirm dialog box. Maptitude restores the values to the ZIP Code column.
12. Choose File>Close Workspace and click Don't Save to close the map, dataview, and Info window without saving any changes.
©2026 Caliper Corporation