Maptitude Help / Working with Tables, Databases, & Charts / Dataview Tools
Dataview Tools
Maptitude has several tools for making edits to an entire table.
- You can create a new table that transposes the rows and columns
- You can group records that contain duplicate values
- You can merge records that contain duplicate values
Transposing a Table
When you transpose a table with the Dataview>Tools>Transpose command, Maptitude writes a new table file where the rows become columns and vice versa. The first column is called Field and contains the field names. The rest of the columns are called [Record 1], [Record 2], etc. and contain the values for the fields; in a dBASE file, they are called RECORD_1, RECORD_2, etc.
You can choose which records to save to the transposed table using a selection set. There is a limit of 255 records to ensure rapid execution and to prevent exceeding the maximum field limit for dBASE (.dbf) files.
 |
TIP: You can also transpose a dataview without creating a new table. See Changing the Way the Dataview Looks. |
 To Transpose a Table
- Open or choose a dataview to transpose. Make sure there is a selection set if you want to transpose selected records.
- Choose Dataview>Tools>Transpose to display the Create Transposed Table dialog box.
- Choose whether to transpose All Records or a selection set from the drop-down list.
- Click OK.
Maptitude transposes the records and opens a dataview of the results.
Doing Frequency Analyses
Maptitude has two commands that let you identify the frequency of duplicate records in a table:
- The Dataview>Tools>Group By command lets you create a table with unique values for one or more chosen fields. The resulting table will include the count of duplicate features and, optionally, other aggregated attributes. For more information on aggregation methods, see Aggregation Methods.
- The Dataview>Tools>Duplicates command lets you tag each record in a table with the count of records with duplicate values of a particular field.
For example, suppose you have the following dataview of street segments in a city:
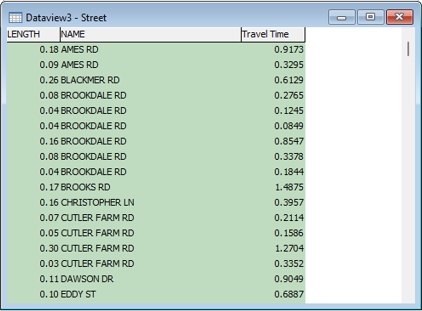
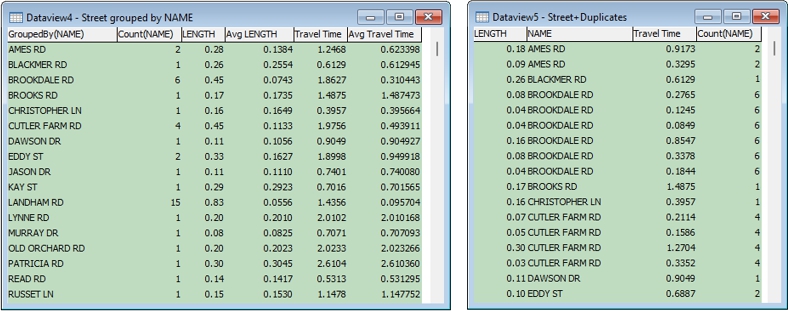
You could use the Group By command to create a table that lists the unique street names in the city, the total length of each street, and its total travel time. Alternatively, you could use the Duplicates command to add a new field that has the count of segments with matching names for each record (below right).
- Click on the column heading or a cell in the field that you want to use to group the data.
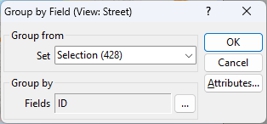
- Choose Dataview>Tools>Group By to display the Group by Field dialog box.
- Choose whether to group all records or a selection set from the Set drop-down list.
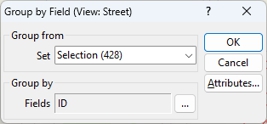
- To group by additional fields, click
 to display the Choose Group By Fields dialog box, otherwise skip to step 7.
 - Choose additional fields from the Available Fields scroll list and click Add>>.
- Click OK to close to return to the Group by Field dialog box.
- Click OK.
Maptitude creates a table of the unique values in the chosen field(s) and displays it in a dataview.
 |
NOTE: To learn about using the Attribute button, see Aggregation Methods. |
To Count Records with Duplicate Values
- Choose Dataview>Tools>Duplicates to display the Duplicates dialog box.
- Choose the field on which to base the duplicate count from the Based on drop-down list.
- Choose whether to create a new field or fill an existing field with the results from the Field drop-down list.
- Click OK.
Maptitude fills the chosen field with the frequency counts, or if you chose Create New Field, displays a joined view with the frequency counts.
Try It Yourself: Grouping Duplicate Records
1. Choose File>Open Workspace or click  on the Standard toolbar, then open the Locator workspace in the Tutorial folder.
2. Right-click on the County layer in the Display Manager and choose New Dataview to open a dataview of the counties in Southern New England. You want to group the county data to see the aggregate values for the states.
3. Click on the State column heading to highlight the column.
4. Choose Dataview>Tools>Group By to display the Group by Field dialog box.
5. Verify that State is chosen in the Field drop-down list.
6. Click OK. Maptitude displays a dataview with the data grouped by state. The Count(State) field shows the number of counties in each state, the Population field shows the total population of each state, the Avg Population field shows the average county population in each state, and so forth.
7. Choose File>Close Workspace and click Don't Save to close the workspace without saving any changes.
Merging Records by Value
The Tools>Editing>Merge by Value command can be used with any table. If the table is associated with an area layer, not only can you merge the records in the table to create a new table, but also you can merge the areas to create a new area geographic file.
If the table is associated with a point or line layer, or is not associated with any layer, you can still use the Tools>Editing>Merge by Value command to summarize records that have common values in a field. For example, if you have a table of data by county with a field containing the state, you could merge the records to get statewide totals. The new table will have one record for each common value. You can control how the numeric fields are summarized.
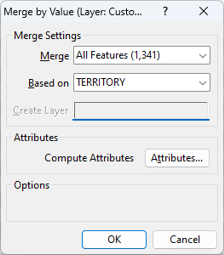
The Merge by Value dialog box will have two differences when you are not creating territories:
- The Create Layer edit box will be disabled, because you will not be creating a new area geographic file
- The Compute Attributes box will be checked and disabled, because you will want to summarize the data
To Merge Records by Value
- Choose a layer from the drop-down list on the Standard toolbar when a map is the active window, or make a dataview active for a table not associated with a geographic layer.
- Choose Tools>Editing>Merge by Value to display the Merge by Value dialog box.
- Make choices as follows:
| To do this... | Do this... |
|---|---|
| Choose which features to merge | Choose whether to use All Records or a selection set from the Merge drop-down list |
| Choose the field containing the common name or value to use for merging | Choose a field from the Based on drop-down list |
- Click OK.
Maptitude merges the records and displays the results in a new dataview.
|
NOTE: To learn about using the Attribute button, see To Change the Aggregation Method when Calculating Demographics. |
Try It Yourself: Merging Records by Value
1. Choose File>Open or click on the Standard toolbar, then open the dBASE file customer.dbf in the Tutorial folder. Maptitude displays a dataview of customers that includes the amount of sales for each customer and the sales territory that they are in. You are going to merge the table by territory to see the sales data by territory.
2. Choose Tools>Editing>Merge by Value to display the Merge by Value dialog box.
3. Choose TERRITORY from the Based On drop-down list.
4. Click Attributes to display the Aggregation Method dialog box.
5. In the SALES row, check the boxes in the Add and Average columns to calculate the total and average sales in each territory.
6. Click OK to return to the Merge by Value dialog box.
7. Click OK. Maptitude merges the records and displays the results in a new dataview.
8. Choose File>Close Workspace and click Don't Save to close the dataviews.
To Create Areas Using the Merge by Value Command
- Choose the layer whose features you want to merge from the drop-down list on the Standard toolbar.
- Choose Tools>Editing>Merge by Value to display the Merge by Value dialog box.
- Make choices as follows:
| To do this... | Do this... |
|---|---|
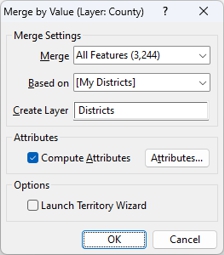
| Choose which features to merge | Choose whether to use All Records or a selection set from the Merge drop-down list |
| Choose the field containing the common name or value to use for merging | Choose a field from the Based on drop-down list |
- Enter a name for the new layer in the Create Layer box.
- To create territories from the new layer, check the Launch Territory Wizard box.
- Click OK.
Maptitude creates an area layer, adds it to the map, and optionally launches the Territory Manager. For more information see, Creating Territories.
Regardless of whether you chose to calculate demographics, you can export demographic overlay data and other information to Excel by making the resulting area layer the working layer and clicking  on the Standard toolbar.
|
NOTE: To learn about using the Attribute button, see To Change the Aggregation Method when Calculating Demographics. |
©2026 Caliper Corporation