Maptitude Help / Working with Tables, Databases, & Charts / Working with Dataviews
Working with Dataviews
The dataview window may not be big enough to display all of the fields and records in your data. As in most Windows products, you can use either use the mouse and click on the scroll bars or use the keyboard to see more. The following table describes how to use the keyboard to move around a dataview:
| Use this key... | To do this... |
|---|---|
| Left Arrow | Move one field to the left |
| Right Arrow | Move one field to the right |
| Up Arrow | Move to the previous record |
| Down Arrow | Move to the next record |
| Page Up | Move up one page of records |
| Page Down | Move down one page of records |
| Home | Move to the first field in the current record (all the way to the left) |
| End | Move to the last field in the current record (all the way to the right) |
| Tab | Move one page of records to the right |
| Shift-Tab | Move one page of records to the left |
| Ctrl-Home | Move to the first record in the dataview |
| Ctrl-End | Move to the last record in the dataview |
In addition, you can:
- Find specific records
- Change the way the dataview looks
- Arrange columns in a dataview
- Sort rows in a dataview
Finding Records
The Edit>Find command helps you find a record in a dataview. You choose the field you want to search and enter the text or numeric value you want to search for. The Edit>Find command also lets you look for a particular field, in a dataview.
When you search for a numeric value, you can search for the closest value or an exact match. If you search for an exact match, Maptitude will display the value if it exists. If the value does not exist, Maptitude will tell you that no record was found with the value you specified. If you search for the closest value, Maptitude will display the next higher value.
When you search for a text value, you can match the whole phrase or look for text that starts with what you typed. If you search for the whole phrase and the value does not exist, Maptitude will tell you that no record was found with the value you specified. If you do not search for whole phrase, Maptitude will display the next higher value.
The Edit>Find command is case sensitive when you search for text. For example, if you are searching for Sri Lanka and type “sri lanka” as the text value, Maptitude will not find the record. Lower case letters are found after upper case letters, so searching for text starting with “AZ” might find a record with text starting with “Aa.” To make searching easier, you can convert a field to all lower case with a formula field using the Lower() function or to all upper case using the Upper() function. For more information on the Lower() and Upper() functions, see Appendix A, Formulas, Conditions, and Functions.
 To Find a Record in a Dataview
- Choose Edit>Find, click
 on the Standard toolbar, or right-click anywhere in a dataview and choose Find. Maptitude displays the Dataview Find dialog box.
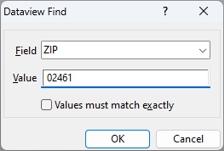
- Choose the field to search from the Field drop-down list.
 |
TIP: You can filter the field list by clicking on the drop-down list and typing several letters. Only fields containing the text you enter will be shown in the drop-down list. |
- Enter the value to find in the Value box and check the Values must match exactly box if you want an exact match.
- Click OK.
If there is a match, Maptitude highlights the record containing the first record with the value you wanted to find. If there is no match and:
• You checked Values must match exactly or Match Whole Phrase option, Maptitude reports that no matching record could be found.
• You did not check the option, Maptitude highlights the first record with the next higher value.
- If you want to find the record on a map, right-click on the highlighted cell and choose Zoom.
To Find a Column in a Dataview
- Choose Edit>Find, click on the Standard toolbar, or right-click anywhere in a dataview and choose Find. Maptitude displays the Dataview Find dialog box.
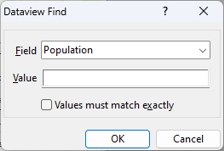
- Choose the field to find from the Field drop-down list.
|
TIP: You can filter the field list by clicking on the drop-down list and typing several letters. Only fields containing the text you enter will be shown in the drop-down list. |
- Leave the Value box blank.
- Click OK.
Maptitude highlights the column you wanted to find.
Changing the Way the Dataview Looks
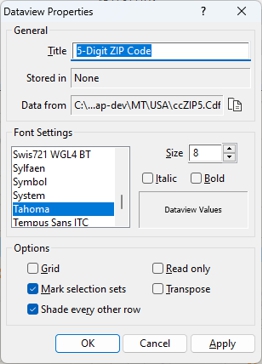
The Dataview Properties dialog box is used for basic dataview display settings.
 |
NOTE: When you first open a table in a dataview, Maptitude uses the default font and other settings. You can change the defaults for dataviews by choosing Edit>Preferences and choosing font settings and other options on the Dataview tab. |
To Change the Dataview Title, Font, and Grid Settings
- Right-click on the dataview window and choose Properties. Maptitude displays the Dataview properties dialog box.
- Make choices as follows:
| To do this... | Do this... |
|---|---|
| Change the title | Edit the text in the Title box |
| Change the font settings | Choose a font from the scroll list, choose a size from the drop-down list, and choose whether to make the font bold or italic using the checkboxes |
| Display a grid around the cells | Check Grid |
| Display a column for each selection set | Check Mark selection sets; See Showing Selection Sets in a Dataview for more information |
| Shade every other row | Check Shade every other row |
| Protect the data from changes | Check Read only |
| Transpose rows and columns | Check Transpose |
|
TIP: To transpose the underlying table, instead of the dataview, see Transposing a Table. |
- Click OK.
Maptitude displays the dataview with the new settings.
|
TIP: You can also get to the Dataview Properties dialog box by clicking |
 on the Standard toolbar and then clicking
  in the Properties column of the dataview you want to modify.
Changing the Column Headings and Display Format
You can change the column headings to make them easier to read, and apply formatting to the values so that commas, decimals, and dollar signs appear the way you want. A column heading can be:
- The internal name for the field
- The display name stored in the dictionary
- A name that you type in the Column Settings dialog box
When you open a table, the column heading for a field will be the display name, if there is one, and otherwise it will be the internal name. When you open a dataview, the column heading for a field will be what you had set it to when the dataview was saved.
The display name or any name that you type in the Column Settings dialog box overrides the internal name as the column heading. You can easily change all the column headings back to the internal names or change them to the display names. For more information on display names, see Creating a New Table from Scratch and Modifying the Structure of a Table.
To Change Column Headings and Display Format
- Choose Dataview>Fields>Properties, click
 on the Standard toolbar, or right-click on the dataview and choose Field Properties. Maptitude displays the Field Properties dialog box, which lists all column headings and display formats. You can filter what fields are displayed by entering some text in the Filter box.
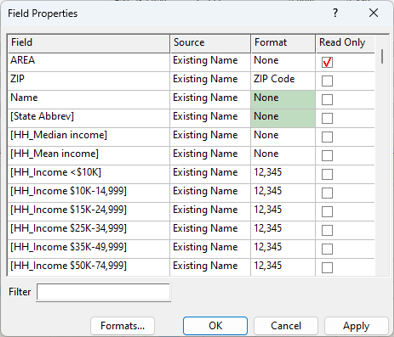
- Make changes to one or more columns according to the following table:
| To do this... | Do this... |
|---|---|
| Change the heading | Type a new name for the field heading in the first column of the grid view. |
| Change the heading to the internal name | Choose Internal Name from the drop-down list in the Source column of the grid view. |
| Change the heading to the display name | Choose Default Display Name from the drop-down list in the Source column of the grid view. |
| Change the heading to the existing name | Choose Existing Name from the drop-down list in the Source column of the grid view. |
| Change the format of number or date fields | Highlight one or more records in the Format column of the grid view and choose a number or date format from the drop-down list. You can also add new formats if you do not see the one you need. For more information see “Creating Custom Field Formats” below. |
| Protect data from changes | For each field that you want to protect, check the box in the Read Only column of the grid view. Uncheck the box to allow the field to be edited. |
- Click OK.
Maptitude displays the dataview with the new settings. Maptitude uses the new name and format in all dataviews and in any new themes you create.
Creating Custom Field Formats
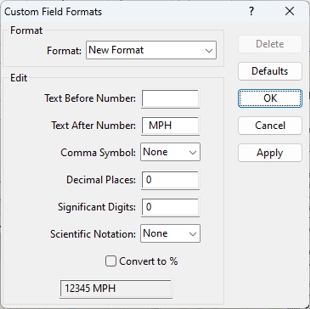
You can create your own formats to customize the way that dataview fields are displayed. Your custom formats are added to the formats in the Format drop-down list when you use the Dataview>Fields>Properties command. The formats will be used for displaying fields in a dataview and for using the field in labels on the map. With custom formats you can:
- Create text prefixes and suffixes around number fields
- Choose to use commas, periods, or no separator between thousand groups
- Choose the number of decimal places and significant digits
- Use scientific notation
To Create Custom Field Formats
- From the Field Properties dialog box, click Formats to display the Custom Field Formats dialog box.
- Choose "New Format" or choose an existing format to modify from the Format drop-down list.
- Make choices as follows:
| To do this... | Do this... |
|---|---|
| Edit the format | Use the edit boxes, drop-down lists, and checkbox to specify text that should appear before or after the number, the comma symbol, decimal places, significant digits, scientific notation, and whether or not to convert to percent. The sample at the bottom shows how numbers will be formatted based on your edits. |
| Delete the format | Click Delete |
| Delete all custom formats | Click Defaults |
- Click OK.
Maptitude closes the Custom Field Formats dialog box. Now any new or changed custom field formats are available for use.
Try It Yourself: Changing the Way a Dataview Looks
1. Choose File>Open Workspace or click  on the Standard toolbar, then open the NESouth workspace in the Tutorial folder.
2. Right-click on County in the Display Manager and choose New Dataview.
3. Right-click on the dataview and choose Properties to display the Dataview Properties dialog box.
4. Check the Grid box and click OK. Maptitude displays the dataview with the new settings.
5. Choose Dataview>Fields>Properties or click on the Standard toolbar to display the Field Properties dialog box.
6. In the Format column of the grid view, click on None in the Population row and choose 12,345 from the drop-down list.
7. Scroll to the bottom of the list.
8. In the Format column of the grid view, click on None in the [HH Median Income] row and drag down to None in the [Per Capita Income] row to highlight both cells, then choose $12,345 from the drop-down list in the second highlighted cell.
9. Click OK. The dataview shows the Population field with the new format. Scroll to the far right of the dataview to see the two income fields with the new format.
10. Choose File>Close Workspace and click Don't Save to close the workspace without saving any changes.
Arranging Columns in a Dataview
You can arrange columns in a dataview in many ways. You can move columns, hide columns, change the width of columns, and lock columns in place so that they remain visible when you scroll left and right in the dataview. If your dataview is for a Caliper geographic layer, you can define groups of fields for display using field sets. For more information, see Creating and Using Field Sets.
 |
For a video tutorial see: (Internet connection required) • Working with Data in Maptitude: Using the Info tool, displaying data in a dataview, and working with dataviews (locking columns, sorting, formula fields, and formatting) |
To Move a Column to a Different Position
|
TIP: Pressing Ctrl-Space on the keyboard will highlight an entire column. |
- Use the left or right arrow keys to move the column left or right.
- Highlight the column you want to hide by clicking on the column heading. To highlight additional columns, press the Ctrl key while clicking on the column headings.
- Click
 on the Standard toolbar.
— OR—
- Right-click on a cell, column heading, or range of cells and choose Hide.
To Change the Width of One or More Columns
- Move the cursor to the right of the column heading so that it changes to a double arrow.
- Click and drag to the left or right to make the column narrower or wider.
- Click on a cell in, or the column heading of, the fields you want to lock.
- Choose Dataview>Fields>Freeze, click
 on the Standard toolbar, or right-click and choose Freeze.
Maptitude unlocks any locked columns. The columns are left in the same order, but all of them now scroll left and right.
To Rearrange the Columns in a Dataview
- Choose Dataview>Fields>Show/Hide or click
 on the Standard toolbar. Maptitude displays the Show/Hide Fields dialog box, which shows all available fields and selected fields in the order they will display.
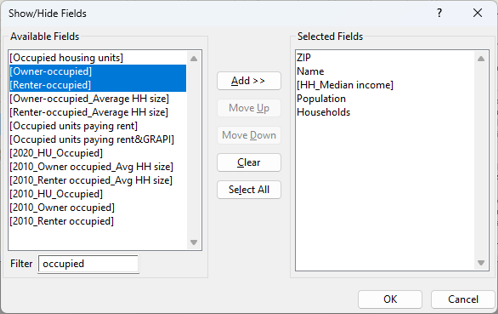
- Choose the fields you want in the dataview as follows:
| To do this... | Do this... |
|---|---|
| Add a field to the dataview | Choose one or more fields in the Available Fields list, and click Add. To find a particular field, type part of the field name in the Filter edit box to display just those fields that contain the text you entered. |
| Add all of the available fields | Click Select All. |
| Drop a field from the dataview | Choose one or more fields in the Selected Fields list, and click Drop. |
| Drop all fields from the dataview | Click Clear. |
| Change the order of fields | Choose one or more fields in the Selected Fields list, and click Move Up or Move Down. |
|
TIP: You can show all columns in a dataview in their original order by right-clicking on a cell or column heading and choosing Show All. |
- Click OK.
Maptitude displays the dataview with the columns arranged in the order you chose.
Try It Yourself: Arranging Columns in a Dataview
1. Choose File>Open Workspace or click on the Standard toolbar, then open the NESouth workspace in the Tutorial folder.
2. Right-click on County in the Display Manager and choose New Dataview.
3. Click on the heading County Name and use the right arrow key to move the column to the right, past the heading Population.
4. Click on the heading State, shift-click on the heading ID to highlight those columns and the DATA column between them, then click on the Standard toolbar to hide those columns.
5. Click between the headings County Name and Families and drag the vertical line to the left to narrow the [County Name] column.
6. Shift-click on the headings County Name and Population, then click on the Standard toolbar to lock those columns on the left side of the dataview.
7. Choose Dataview>Fields>Show/Hide or click on the Standard toolbar to display the Show/Hide Fields dialog box.
8. Click Clear to remove all fields from the Selected Fields scroll list.
9. Type “mode” in the Filter edit box to see all of the fields with “mode” in their name.
10. Click and drag to highlight all of the fields in the left column, click Add>>, and click OK.
11. Choose File>Close Workspace and click Don't Save to close the workspace without saving any changes.
Sorting Rows in a Dataview
When you create a dataview, the records are displayed in the order in which they are stored. You can sort the records in a dataview to make it easy to find records with the highest and lowest values, or to produce a ranked list.
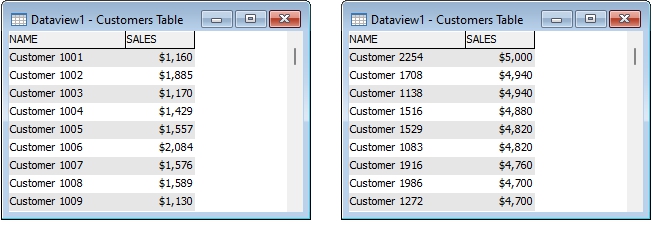
An unsorted dataview of customers (left) and the same dataview sorted by decreasing sales (right).
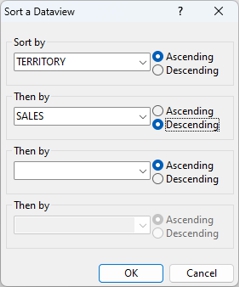
You can sort a dataview based on a single field or on several fields. For example, you could sort customers by state, then by last name, and then by first name.
You can also use the Sort Manager to create and use sort sets, which are stored sort orders using one or more fields, with dataviews for layers from Caliper Standard (.DBD) and compact (.CDF) geographic files.
|
For a video tutorial see: (Internet connection required) • Working with Data in Maptitude: Using the Info tool, displaying data in a dataview, and working with dataviews (locking columns, sorting, formula fields, and formatting) |
To Sort Records Based on a Single Column
- Click on a cell in, or the column heading of, the field you want to sort.
- Choose how to sort as follows:
| To sort records in... | Do this... |
|---|---|
| Increasing order | Click  on the Standard toolbar or right-click on the cell or heading and choose Sort Increasing to sort the records in increasing. on the Standard toolbar or right-click on the cell or heading and choose Sort Increasing to sort the records in increasing. |
| Decreasing order | Click  on the Standard toolbar or right-click on the cell or heading and choose Sort Decreasing to sort the records in decreasing order. on the Standard toolbar or right-click on the cell or heading and choose Sort Decreasing to sort the records in decreasing order. |
Maptitude sorts the records and displays the dataview with the rows in the new order.
To Sort Records Based on Several Fields
- If you want, select one or more columns by clicking on the column headings. Maptitude highlights the selected columns.
- Choose Dataview>Fields>Sort to display the Sort a Dataview dialog box.
- Choose the fields on which to sort and the sort order.
- Click OK.
Maptitude sorts the data based on the fields you chose and displays the data in the new order.
- Choose a dataview for a layer from a Caliper Standard or compact geographic file.
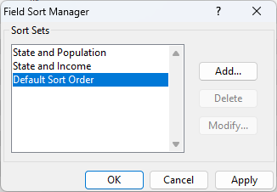
- Choose Dataview>Fields>Sort Manager. Maptitude displays the Field Sort Manager dialog box.
- Make a choice as follows:
| To do this... | Do this... |
|---|---|
| Use an existing sort set | Highlight the sort set in the scroll list. |
| Create a new sort set | Click Add to display the Define Sort Set dialog box. The initial fields in the Selected Fields DataGrid will be those of the sort set that was highlighted when you clicked Add. Highlight fields in the Available Fields scroll list and click Add>> to add them to the Selected Fields DataGrid. To drop fields, highlight them in the Selected Fields DataGrid and click <<Drop. To change the sort order, click on a cell in the Sort column and choose Ascending or Descending. Click OK when you are done and enter a name for the sort set. |
- Click OK.
Maptitude orders the records in the dataview based on the sort set.
To Display Records in Their Original Order
- Choose Dataview>Fields>Sort to display the Sort a Dataview dialog box.
- Choose Natural Order from the top of the Sort By drop-down list.
- Click OK.
— OR—
Maptitude displays the data in the original order.
Try It Yourself: Arranging Rows in a Dataview
1. Choose File>Open Workspace or click on the Standard toolbar, then open the NESouth workspace in the Tutorial folder.
2. Right-click on County in the Display Manager and choose New Dataview.
3. Click on the heading Population and click on the Standard toolbar to sort the counties in descending order by population.
4. Click on the heading State and Ctrl-click on the heading Population to highlight both columns.
5. Choose Dataview>Fields>Sort and click OK to sort the counties by ascending population within each state.
6. Choose File>Close Workspace and click Don't Save to close the workspace without saving any changes.
©2026 Caliper Corporation