Maptitude Help / Working with Tables, Databases, & Charts / Displaying Data for Map Features
Displaying Data for Map Features
There are several tools for displaying information about features in a map:
- The Info tool is used to click on a map and display complete information about the nearest feature(s) in the working layer
- There are two tools for displaying data for multiple layers in a map when you click on a map.
- The Hover tool displays more limited information about features when you simply move the cursor over a feature in the map.
Displaying Data with the Info Tool
Use the Info  tool to see all of the data that are available for a single map feature in an Info window on the screen. When you click on the map with the Info tool, Maptitude shows data for the nearest visible map feature in the working layer of the map. The name of the working layer is displayed in the drop-down list on the Standard toolbar. You can also drag a circle on the map with the Info tool to display information on all the visible features contained within the circle. Features that are not visible because they are hidden or autoscaled off will not be displayed.
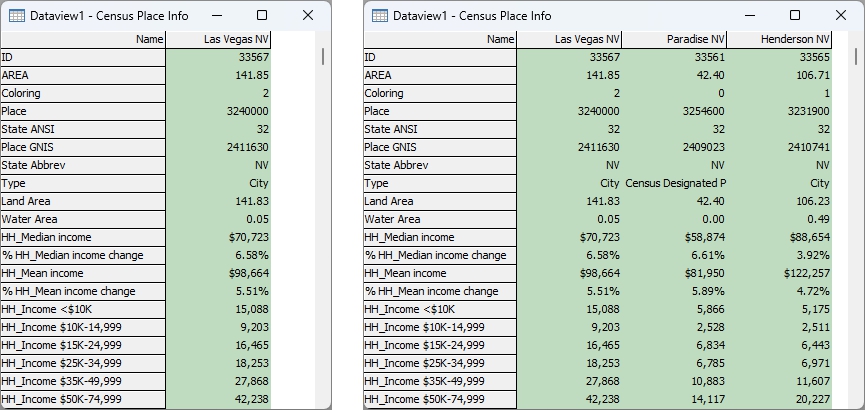
The Info tool also lets you access links between map features and pictures, websites, multimedia files, text files, spreadsheets, and other types of documents. For more information, see Linking Documents, Files, & Web Sites to Map Features.
You can do many of the things in an Info window that can be done in a dataview. See Working with Dataviews for more information.
 |
For a video tutorial see: (Internet connection required) • Working with Data in Maptitude: Using the Info tool, displaying data in a dataview, and working with dataviews (locking columns, sorting, formula fields, and formatting) |
 To See Information on Map Features
- Choose the layer whose data you want to see from the layer list on the Standard toolbar or by right-clicking on the layer in the Display Manager and choosing Make Working Layer.
- Click
 Info in the Info drop-down on the Standard toolbar.
 - Click on a feature on the map or click and drag a circle around several map features. Maptitude marks each feature with an “i” and displays all available data for the feature(s) in the Info window.
You can continue to click other features on the map to display the data for each one. You can press the Shift-click on the map to add features to the Info window, or Ctrl-click on a feature that is already marked with an “i” to remove a feature from the Info window.
- You can leave the Info window on screen, or close it by clicking the close box in the upper right corner or choosing Close from the system menu in the upper left corner.
- Right-click on the Info window and choose Print, to display the Print Dataview dialog box.
- Choose the printer and other settings.
- Click OK.
Maptitude prints the Info window.
To Export an Info Window to an Image or Table
- Right-click on the Info window and choose Export to Image or Export to Table to display the Save As dialog box.
- Choose a file type from the Files of Type drop-down list.
- Type a new name for the info window file.
- Click Save.
Maptitude saves the Info window into a file of the chosen type. For more information on file types, see Saving and Opening Dataviews.
Try It Yourself: Displaying Data with the Info Tool
1. Choose File>New Workspace or click  on the Standard toolbar, choose New map of {country name}, then use Create-a-Map Wizard to create a map of your ZIP/Postal Code.
2. Click Info in the Info drop-down on the Standard toolbar and click somewhere within your postal code area. Maptitude displays data for the postal code in the Info window. Click on neighboring postal code features to display data for them.
3. Right-click on Street in the Display Manager and choose Make Working Layer.
4. Click on a street segment with the Info tool. Maptitude displays data for the street segment in the Info window. Click on other street features to display data for them.
5. Choose File>Close Workspace and click Don't Save to close the workspace without saving any changes.
Displaying Data for Multiple Layers
Maptitude has two tools for getting information on features in more than one layer in a map:
| Tool | Description |
|---|---|
 |
Multi-Layer Info tool: finds the points, lines, and areas at or near the location where you click, then displays all the fields for one feature at a time |
 |
Multi-Layer Area Info tool: finds the area feature in each area layer at the location where you click, then displays one field for each area feature |
Once you start using a tool, you can click at other locations on the map to get information on other features.
The Multi-Layer Info tool is similar to the Info window, since all of the data for a feature is in a column, and each row has the value for a field. Though you can only see the information for one feature at a time, it is very easy to switch among the features in the layers. A tree list contains an entry for each layer, and an entry can be expanded to show all of the features found in that layer.
The Multi-Layer Area Info tool lets you compare the areas at the location where you clicked. You can choose to show the value for one field for each area layer; usually it is the same or similar fields, such as Name or Population. You can add, drop, and rearrange the area layers to meet your needs. Maptitude keeps the current settings until you close the program.
To Use the Multi-Layer Info Tool
- Click Multi-Layer Information in the Info drop-down on the Standard toolbar to activate the Multi-Layer Info tool.
- Click at a location on the map. Maptitude displays the Multi-Layer Information dialog box and shows the information for the first feature in the first layer.
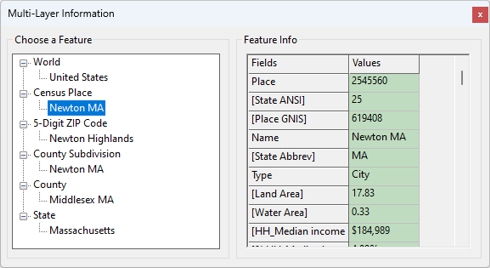
- Make choices as follows:
| To do this... | Do this... |
|---|---|
| Show the features for a layer | Click the plus (+) sign next to the name of the layer in the tree list |
| Show the information for a feature | Highlight the feature in the tree list |
| Hide the features for a layer | Click the minus (-) sign next to the name of the layer in the tree list |
- Continue clicking at locations on the map, and Maptitude will update the tool.
- To edit values that are not read-only, click on a cell and type a new value or double-click on a cell and edit an existing value.
- You can leave the Multi-Layer Information tool on the screen, or close it by clicking the Close box in the upper right corner.
To Use the Multi-Layer Area Info Tool
- Click Multi-Layer Area Information in the Info drop-down on the Standard toolbar to activate the Multi-Layer Area Info tool.
- Click at a location on the map. Maptitude displays the Multi-Layer Area Information dialog box with information about the area features where you clicked.
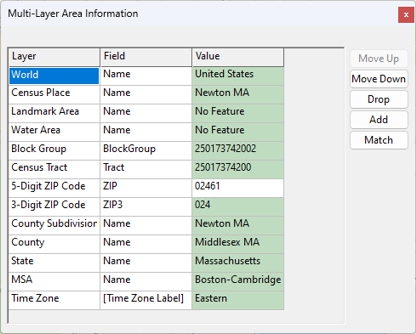
- Make choices as follows:
| To do this... | Do this... |
|---|---|
| Change the field for an area layer | Click in the Field column for the layer and choose a field from the drop-down list. Maptitude will update the value for the layer. |
| Set the field for other layers to match the highlighted layer | Click on the row with the field you want to use and click Match. All layers that include a field with the same name will change. |
| Drop an area layer | Click on the row for the layer and click Drop. Maptitude removes the layer from the list. |
| Add an area layer | Click Add to display the Choose Layer to Add dialog box, highlight an area layer, and click OK. Maptitude adds the layer to the bottom of the list. |
| Rearrange the area layers | Click on a row for a layer and click Move Up or Move Down. |
- Continue clicking at locations on the map, and Maptitude will update the tool.
- To edit values that are not read-only, click on a cell and type a new value or double-click on a cell and edit an existing value.
- You can leave the Multi-Layer Area Information tool on the screen, or close it by clicking the Close box in the upper right corner.
Try It Yourself: Displaying Data for Multiple Layers
1. Choose File>New Workspace or click on the Standard toolbar, choose New map of {country name}, then use Create-a-Map Wizard to create a map of your ZIP/Postal Code.
2. Click Multi-Layer Area Information on the Standard toolbar to activate the Multi-Layer Area Info tool.
3. Click on the map. Maptitude displays the Multi-Layer Area Information tool and shows the names of the all of the area features in the map where you clicked (The features will vary depending on the country package you are using, but may include country, state, postal code, county, landmark area, etc.).
4. If the ZIP/Postal Code field is displaying the name, click Name in the Field column and expand the drop-down list.
5. Choose ZIP (or Postcode, FSA, Postcode District depending on the Country Package) from the drop-down list. Maptitude updates the value for the ZIP Code layer.
6. Click other locations on the map. Maptitude updates the Multi-Layer Area Information tool with information for the location where you clicked.
7. Highlight the Name field in any other layer and click Match. Maptitude updates the ZIP Code layer with its Name field.
8. Click the Close button on the top right of the Multi-Layer Area Information tool to close it.
9. Choose File>Close Workspace and click Don't Save to close the workspace without saving any changes.
Displaying Data with the Hover Tool
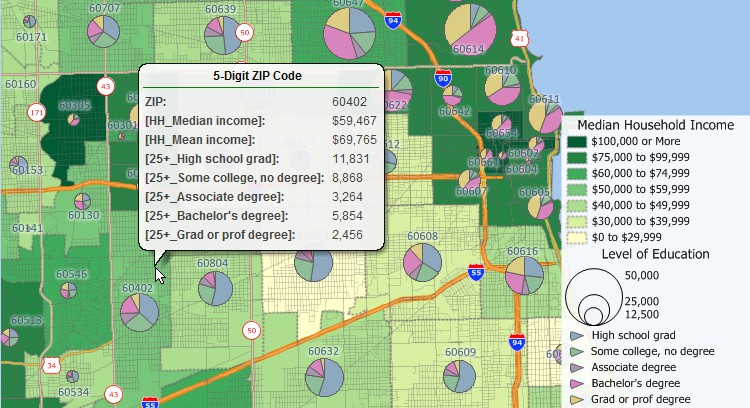
You can choose to show information for map features in a popup hover bubble. When you pause the cursor on a map, information will be displayed about a feature near where you paused. You can choose up to ten fields to display in the popup hover bubble.
 |
TIP: Data fields that are used in themes are automatically shown in the hover bubble. |
To Set Up the Hover Tool
- Choose Edit>Preferences and click the Hover tab.
- Choose Hover tool settings as follows:
| To do this... | Do this... |
|---|---|
| Set the font settings | Choose a font, size, style, and color settings in the Font Settings frame |
| Set the background color | Choose a color from the drop-down list and enter an opacity level between 0 and 100 |
| Set the Hover tool shape | Choose Balloon or Rectangle from the radio list |
| Display data for the working layer | Choose the Over Working Layer radio button; the Hover tool will then only display information for the working layer |
| Display for multiple layers | Choose the Over All Layers radio button; the Hover tool will display information for the closest feature based on the layer priority set in the Hover Settings dialog box |
| Set the time before the Hover appears | Enter a value in the Delay box |
| Set the time until the Hover disappears | Check the Timeout box and enter a time in seconds |
| Specify the snap tolerance | Change the value in the Maximum Distance from Feature spinner |
- Click OK.
To Enable the Hover Tool
Maptitude will display the hover using the settings specified on the Hover tab of the User Preferences dialog box. Choose Map>Labels>Display Hover again to turn off the Hover tool.
To Choose the Layers and Fields to Display in the Hover Tool
- Choose Map>Labels>Hover Settings to display the Hover Settings dialog box.
- Check the box in the Hover column next to any layers for which you want to see data. Click Select All to check all fields or Clear All to remove the check from all fields.
- Click on a layer in the grid and click Hover Fields.
- Choose up to ten fields from the Available Fields scroll list to add to the Selected Fields scroll list and click OK.
- Repeat steps 3-4 for any additional layers.
- If you chose to have the Hover tool work over more than one layer, use the Move Up and Move Down buttons to choose the layer priority from lowest to highest.
- Click Close.
|
TIP: Data fields that are used in themes are automatically shown in the hover bubble. |
©2026 Caliper Corporation