Maptitude Help / Using Themes to Present Information
Using Themes to Present Information
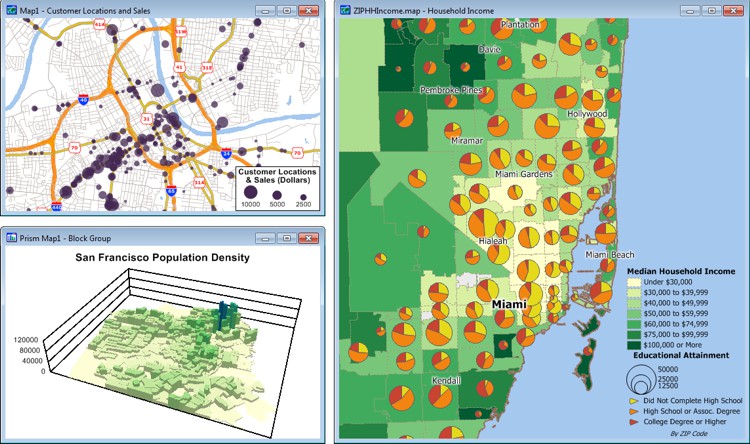
Maptitude can assemble information about map features to create a map that illustrates the patterns in the data. This is called a thematic map. Thematic maps use distinctive colors, symbols, and fill styles to portray data such as population, transit ridership, mode split, or income. The different styles highlight the similarities and differences among map features.
In some kinds of thematic maps, Maptitude changes the appearance of each feature based on its characteristics. In other types of thematic maps, Maptitude displays charts or symbols on each feature to illustrate comparative information. When data are portrayed in a thematic map, the information becomes easier to see, understand, and interpret.
With Maptitude Online, you can share your thematic maps with your teams. For more information, visit www.caliper.com or call Maptitude Sales at 617-527-4700.
 |
For a video tutorial see: (Internet connection required) |
Topics in this section:
©2026 Caliper Corporation