

Winter 2020-2021
Welcome!
Welcome to our latest transportation newsletter. We send our best wishes to you and yours in these difficult and unusual times, and we especially send you our hopes for a Happy and Healthy Holiday season. While we at Caliper, and undoubtedly most of you, have been at home and working remotely for many months now, our work continues and has, as usual, kept us very busy.
The lessened traffic on our roads might suggest that we all have better things to do than traffic modeling, but it is also important reminder that forecasting is an intimidatingly difficult task and one that will not always be successful. Before COVID-19, it was clear that Transportation Network Companies (TNCs) and the emergence of automated and connected vehicles would change the nature of future transportation in our cities and regions. Now, we know that we will have to account for significant behavioral changes, some of which may be short term and others that are likely to be long lasting. Working remotely and shopping without traveling are behaviors that will retain traction.
Never will the need for better analysis be greater than as we hopefully emerge from COVID-19's scourge because simple trend extrapolation is likely to be a hollow exercise. Change itself provides the opportunity to measure responses, deepen our understanding of traveler behavior, and update the fidelity and efficacy of our approaches to forecasting that time slice of the future that might be foreseeable.
This is a good time to think about a reformulation of our approaches, a refresh of our priorities, and a modernization of our modeling implementations. It is also a good time to be realistic about our work and how it has failed to produce the practical breakthrough that was so very much desired and sought by researchers and practitioners. Rather than be pessimistic, there is now the opportunity to refashion the approaches to planning and traffic analysis that was originally conceived 30 to 70 years ago.
Where can we start? For one thing, we can drop the practice of making forecasts of future scenarios that have only one outcome and instead recognize that for many reasons including errors in data and models, it is a range of outcomes that should be a characteristic of our forecasts. We can embrace the exploratory modeling of a wide range of outcomes that FHWA has recently researched.
Second, we can depart from the notion that any one specific type of model or overall regional model will deliver the behavioral reality and policy sensitivity that is so deeply desired. Different types of models are likely to be best for different issues and contexts, and we should be able to accept the fact that specific large projects or policy initiatives must be analyzed with specific data collection and models that are constructed for the purpose of assessing those projects. One general model for each region will not be able to inform our judgments about all project merits. More rigorous evaluations of models's efficacy should be required.
Third, we can depart from over-reliance on cross-sectional analysis with its implicit assumption that changes through time can be inferred from the behavior of a cross-section of the population at any one point in time and understand that this requires a completely different approach to data collection.
A related concern is the limited applicability of revealed preference data that is never fully adequate to address alternatives that are new to the marketplace. Stated preference analysis or some parametric analysis of alternative futures will need to be part of our toolkit.
Lastly, through reproducible and demonstrably valid research, we should develop and deploy new modeling methods that take advantage of the vast computing power now available and all of the relevant reliable data that can be reasonably obtained. At the same time, we need to be conversant with the limitations and the biases that are associated with data from convenience or otherwise limited samples.
Are we up for the challenge? We certainly hope so and hope you share the same feeling!
This newsletter provides a window on some of our activities during the past year. Our interest in sharing this information is in the hope that you will share your views with us.
Important New Applications
The past year was a time for significant new tool creation on Caliper platforms. Three major TransCAD applications we created should be useful to many MPOs and State DOTs. These applications require separate set-up and some customization, but those tasks can be performed quickly and efficiently. These are U.S. centric applications, but with the availability of similar data, can also be applied in other countries.
NPMRDS Performance Analysis TransCAD Toolset
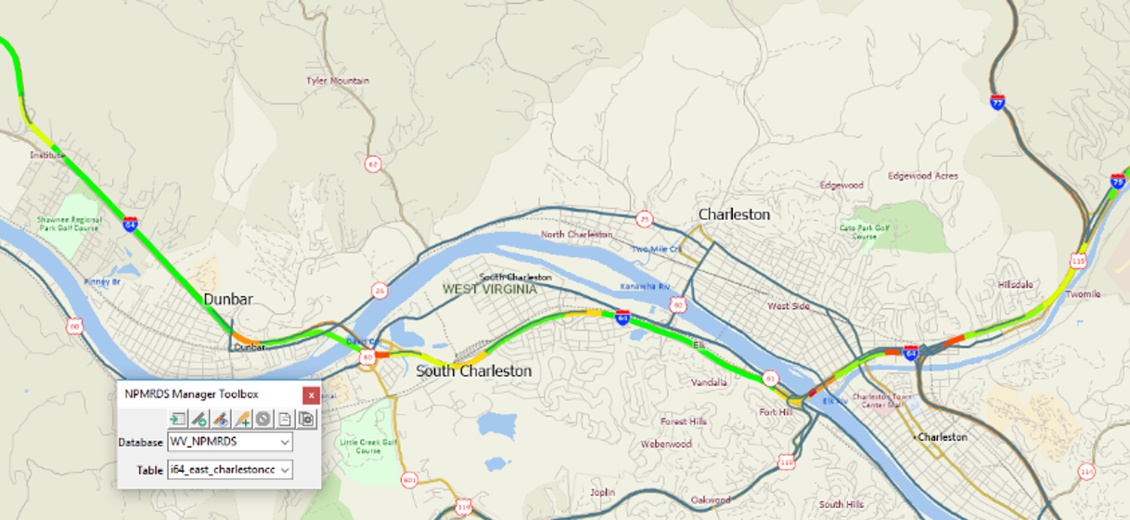
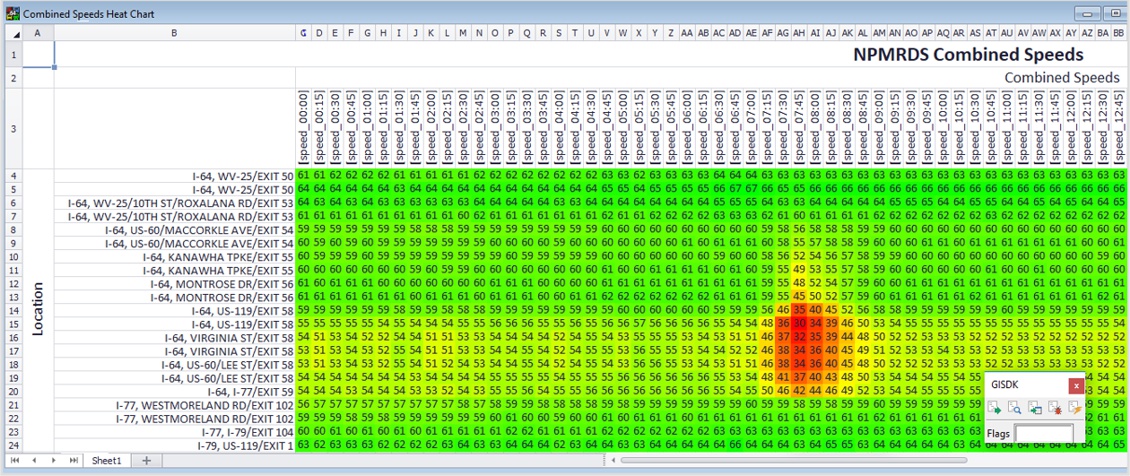
Caliper has developed a suite of tools to facilitate calculation of the performance measures mandated by the MAP-21 legislation using the travel time and speed data from the National Performance Management Research Data Set (NPMRDS) or similar sources of archived travel time, such as INRIX XD. The tool is unique in that users can compute these measures for any section of the network, including corridors, subregions, or origin-destination pairs. The tool allows users to define a corridor by simply clicking between two points on a map, and to visualize the Level of Travel Time Reliability (LOTTR) and other relevant performance measures on the corridor roadway segments on a TransCAD map. The tool will also report similar performance measures for the entire roadway database, if desired. For corridors, the tool also performs a similar visualization using speeds and generates a heat map illustrating how the speeds vary by 15-minute time period along the corridor. The toolkit utilizes TransCAD to access a year's worth of NPMRDS data in 15-minute bins for every day of the year. Due to the massive quantity of data required for this analysis, it is stored in a Database Management System (DBMS) external to TransCAD. This project used PostGreSQL for the DBMS primarily for its efficiency in working with large databases and its seamless integration with TransCAD. The output of the tool is both graphical and tabular, with one of the highlights being a temporal heat map of the speeds on a corridor by accessing the built-in chart engine in TransCAD.
The initial development and design of the tool was performed in cooperation with the West Virginia DOT under the auspices of a SHRP2 Reliability Program grant. It was subsequently extended to work with INRIX XD data in a project for the Grand Valley Metropolitan Council (Grand Rapids MPO) and Michigan DOT. The tool has enabled its users to readily consider reliability and observed speeds in their Statewide Transportation Improvement Plans (STIP) and LRTPs more easily. The tool also permits users to compute and report the Federally mandated performance measures more efficiently and for different subsets of features. The Grand Rapids implementation computes an even wider variety of measures, including Travel Time Index (TTI), Planning Time Index (PTI), and Buffer Index (BI), at the planning network link level based on the INRIX XD segment geography conflated to the planning network line database. For further information on this tool and its applicability to your region, please contact Paul Ricotta.
Below is a screen capture of two of the outputs from the tool, a mapping of LOTTR on the TransCAD map and a temporal heat map for the same corridor:
TransCAD Transportation Planner's Accessibility Toolkit
Over the years, Caliper has been evolving tools for measuring transportation accessibility with multiple modes and metrics. In research funded by FHWA in 2013, we established that very fine-grained calculations were needed and were able to develop some algorithmic solutions that facilitated the billions and trillions of shortest path calculations needed to measure accessibility from every street intersection to every other street intersection in large regions. These solutions also required accurate all-streets networks and conflation of GTFS routes to those networks. With these inputs, a variety of different accessibility metrics can be calculated and compared for scenarios that include transportation project improvements.
In one particular application for the Virginia DOT, the accessibility toolkit was applied to the problem of scoring potential new projects on the basis on increased accessibility benefits. The VDOT system replaced a vastly more expensive and less capable solution from another vendor. The VDOT solution handles 4 modes of travel and origins and destinations within all of Virginia and 30 miles beyond in all directions. Thus, it includes the District of Columbia and much of Maryland. An all-streets road network from HERE is used to calculate accessibility for driving, cycling, and walking. GTFS files for all the transit systems in the modeled area were conflated to that network.
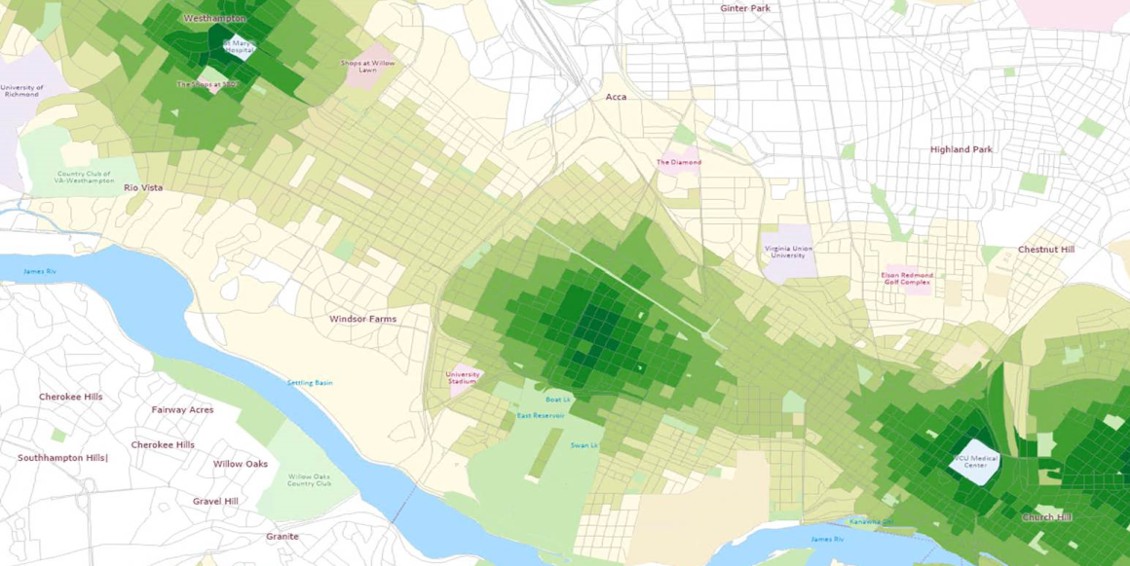
Walk Accessibility to Health Care Facilities in Richmond, VA
FAF 5 Freight Flow Disaggregation and Network Assignment Process Software
Working for the FHWA Office of Freight Operations, Caliper developed a new software tool for disaggregating the forthcoming Freight Analysis Framework (FAF) 5 data to allocate commodity flows and truck trips between approximately 3500 county-to-county and port origins and destinations to a national road network. Based on TransCAD, the tool includes a new type of truck assignment model. Caliper donated most of the resources to create an accurate national road network that is suitable for freight modeling. HPMS data from all 50 states were then conflated to the new network. NPMRDS data were also appended to the network for the links where speeds are reported. Since truck flows do not follow equilibrium assignment rules, an alternative and superior route choice model was implemented. Limited checking against truck route traces from ATRI suggested that the path enumeration process and the flow allocation seemed very realistic. This new truck assignment method holds great promise for use in statewide models.
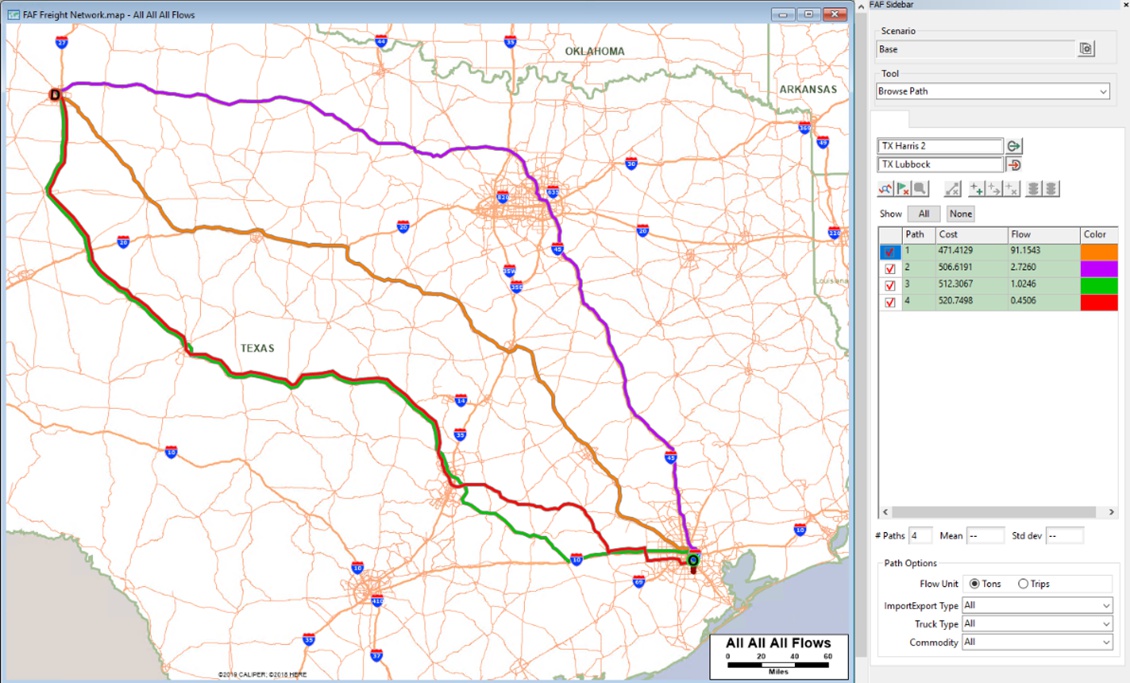 Estimated Truck Flows between Lubbock and Houston in Texas
Caliper is now working to generate the FAF5 disaggregate data and is enhancing the tool to incorporate FHWA feedback and add further capabilities for flowing the freight data, estimating truck trips, and querying the flows in myriad ways
TransCAD 9 Has Just Begun Shipping
Apart from some meaningful performance enhancements, TransCAD 9 comes with many enhancements for model developers and model users. For users, one of the most dramatic additions are many new and useful visualizations.
There is also new functionality for reaching out to web services for obtaining data that is extremely valuable for calibrating and validating models. Skim matrices by mode can be filled with queries from Google, HERE and Bing.
For both model users and model developers, there have been significant enhancements to the flow chart user interface tools enabling greater functionality and more effective collaborative development.
For simpler programming of tasks, you can now script TransCAD with Python and you can call Python programs from TransCAD.
Similarly, you can call GISDK functions from R and call R programs from TransCAD.
There is a new population synthesizer procedure that has been greatly enhanced in functionality, and is very quick to run, making it possible to incorporate it into model runs if desired. Importantly, the population synthesizer can be used incrementally to update a base year to a future population, particularly to update a subset of zones without disrupting the overall integrity of the regional result.
There is support for estimation of the parameters of disaggregate destination choice models and new features for calibrating mode and destination choice models.
There have been further improvements in multi-threading that will be experienced on machines with very large numbers of cores that were not envisioned when multi-threading was first enabled in TransCAD many years ago.
Data
For U.S. users, an array of useful datasets will be available for TransCAD 9. These will include an updated transportation profile at the block group level based on the latest American Community Survey. There will also be a current 5-digit ZIP Code layer with demographics.
New will be a Caliper-produced highway network suitable for national level modeling. There will also be a national rail network that includes both freight and passenger carrier networks. Census 2020 geography and block level data will be available once it is released in Spring 2021.
HERE network data is now available for most of the countries in the world and can be licensed at modest fees for use with TransCAD. There is a Western European network suitable for routing as well
TransModeler 6 Was Recently Released
The most effective traffic simulation software available, TransModeler 6.0, takes significant strides in advancing Caliper's mission to make traffic microsimulation more accurate, more affordable, and more scalable. Complex or time-consuming tasks are easier to accomplish in TransModeler 6.0 with an array of built-in tools, making it the most user-friendly simulation software package available.
Mesoscopic and microscopic simulation, along with dynamic traffic assignment (DTA), are now faster and more cost-effective than ever before. Moreover, TransModeler was enhanced to model the tours and trips that are generated by ABMs preserving essential time constraints on trip making.
Other refinements include more faithful reflection of US vehicle fleets and driving behaviors out of the box without compromising the ability to adjust settings to model traffic conditions anywhere in the world. TransModeler now supports many forms of connected and autonomous vehicle (CAV) modeling and is being used in projects preparing for CAV futures.
DTA Update
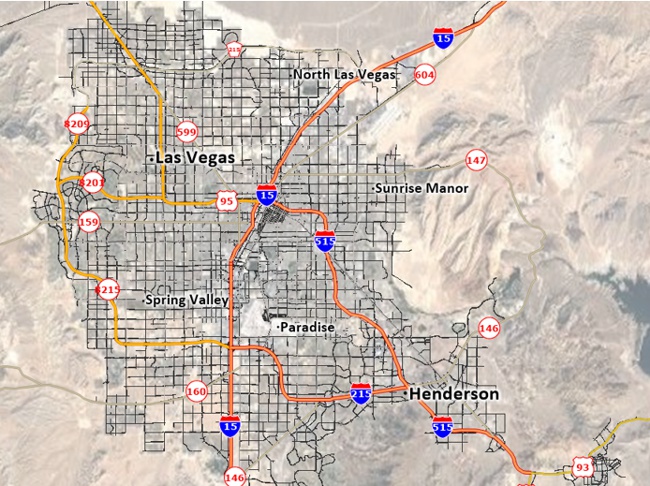
Our work building large regional DTA models continued with the development of models for the Las Vegas RTC and a large swath of Southern Michigan for Michigan DOT. There are both mesoscopic and microscopic models for Las Vegas, each with different potential applications.
The mesoscopic DTA model runs on centerline geography without requiring a detailed lane-level model of streets and intersections. The mesoscopic model will also serve the RTC as a planning-level DTA that can be used to achieve a quick estimation of project benefits.
The microscopic DTA will support projects that require more accurate predictions of traffic operations and project impacts. Three projects were analyzed with the regional microsimulation model to demonstrate the range of applications for which it can be used: conversion of express lanes on I-15 to HOV lanes, dedicated bus lanes, and BRT operation, and a major interchange and ramp reconstruction project.
Both DTA models integrate with the RTC's travel demand model in TransCAD and will enable the RTC to make more robust decision-making when it comes to selecting or prioritizing projects as part of their planning processes.
For the Michigan DOT, we developed a mesoscopic and hybrid DTA model spanning much of the Southeast Michigan Council of Governments (SEMCOG) region. The multi-resolution model will support the development of microsimulation models of major corridors in the region that will allow for operational analysis of maintenance-of-traffic (MOT) strategies for major projects on the horizon.
This multi-resolution modeling system is integrated with and leverages MDOT's and SEMCOG's regional planning model in TransCAD, which served as the point of departure in developing the time-varying demand inputs for the DTA. The DTA, in turn, was calibrated to historical 15-minute counts and bottleneck locations in the region and will be used to develop time-varying demand inputs for microsimulation analysis of smaller areas. In this multi-resolution modeling framework, analyses performed at each scale and resolution will contribute to the improvement and advancement of the models at all scales and resolutions.
Agent-based and Activity-based Modeling Support
Over the past decade Caliper has been adding the building blocks for agent-based and activity-based disaggregate models to TransCAD. These building blocks permit constructing high performance models with flexible behavioral assumptions and choice models. As a result, there will be both native Caliper agent-based models and better software implementation of some existing activity-based models.
New Caliper Staff
Dr. Arun Akkinepally
 Dr. Akkinepally joined
Caliper as a Senior Transportation Scientist from the MIT
Intelligent Transportation Systems Lab where he led research
projects involving activity-based modeling, dynamic traffic
simulation, and real-time traffic control.
Dr. Akkinepally joined
Caliper as a Senior Transportation Scientist from the MIT
Intelligent Transportation Systems Lab where he led research
projects involving activity-based modeling, dynamic traffic
simulation, and real-time traffic control.
Dr. Akkinepally was among the principal authors of SimMobility, an integrated travel simulation platform, and has led the incorporation of smart-mobility services like on-demand ride-sharing and car-sharing and automated vehicles into the simulator.
Arun performed research on a real-time simulation-based predictive tolling system that determines tolls dynamically that maximize revenue and maintain desired level-of-service. He also led the development and application of the system to the NTE TEXpress lanes in Dallas, Texas.
Dr. Akkinepally also worked on the development of a real-time model system for network management and emergency response in DynaMIT 2.0 —a DTA system for traffic state estimation and prediction through a wide variety of real-time information. He actively contributed to developments in online calibration, applications in dynamic tolling, and simulation of multi-modal services. This work resulted in him receiving an award for the Best Simulation Application Paper at the 97th Annual Meeting of the Transportation Research Board.
Arun is an acknowledged expert on incorporation of reliability into transportation models and has developed several breakthrough algorithms for doing so. He holds Bachelor's and Master's degrees in Civil Engineering and a PhD in Transportation Engineering all from the Indian Institute of Technology in Madras, India.
Vishal Khanapure
 Vishal
Khanapure
joined Caliper last June in the dual roles of
Senior Software Engineer and Senior Transportation Engineer. Vishal
is a leader in the development of traffic and safety software with
more than 10 years of experience in creating software tools for
traffic engineers.
Vishal
Khanapure
joined Caliper last June in the dual roles of
Senior Software Engineer and Senior Transportation Engineer. Vishal
is a leader in the development of traffic and safety software with
more than 10 years of experience in creating software tools for
traffic engineers.
Vishal was formerly the Asst. Director of the McTrans Center at the University of Florida where he supervised the development and support of the Highway Capacity Software. Vishal is also a key contributor to traffic and safety research as well as an expert trainer for the Highway Capacity Manual (HCM). At Caliper, Vishal will be based in Austin, Texas. He is also a member of the TRB Highway Capacity and Quality of Service Committee, which oversees the HCM.
Dr. Tom Creasey, Caliper's Vice President of Traffic Engineering, stated that "Vishal is a significant addition to our technical staff where I expect him to play a major role in expanding and improving our traffic analysis tools, conducting research on improved methods, and helping us support the users of our transportation software products."
Dr. Vince Bernardin, Jr.
 Vince
Bernardin, Jr., PhD, is an internationally recognized
expert in transportation demand forecasting with over 17 years of
experience who has worked in 26 U.S. states, Canada, and
Australia developing and applying statewide, urban, and
corridor-level travel forecasting models for both plan development
and major project studies. He has both contributed to and managed
the development of more statewide models than anyone else in the
field; twelve models as a contributor and five as project manager.
Vince
Bernardin, Jr., PhD, is an internationally recognized
expert in transportation demand forecasting with over 17 years of
experience who has worked in 26 U.S. states, Canada, and
Australia developing and applying statewide, urban, and
corridor-level travel forecasting models for both plan development
and major project studies. He has both contributed to and managed
the development of more statewide models than anyone else in the
field; twelve models as a contributor and five as project manager.
Dr. Bernardin has been at the forefront of data-driven travel modeling and forecasting using big data for a decade. He was the first to use big data for statewide modeling (2010) and activity-based modeling (2016). He has worked with nearly every major source of big data in transportation, including both aggregate (StreetLight, AirSage, HERE) and disaggregate (ATRI, Safegraph, Cuebiq, INRIX) data.
In addition to his work with big data, Vince is widely known for his development of hybrid models, that combine elements of activity-based and trip-based models. He also offers considerable experience with the development and application of tools for associated emissions and economic analyses. With his broad experience and track record of successful innovation, Vince brings great technical expertise and creativity to addressing client needs.
Dr. Bernardin is the current chair of the Urban Big Data Subcommittee of the Transportation Research Board (TRB) of the National Academies (of the U.S.), a past chair of TRB's National Transportation Planning Applications Conference, and a member of several of TRB's standing committees.
TRB 2021
TRB will be quite a different experience for all of us this January. We will miss seeing you in person, but as a strong supporter of TRB, we hope that you will participate in the novel format that will be used. The Caliper booth will be in Hall 14 of the virtual exhibit halls (this link takes you directly to the Caliper booth if you are already logged in. If you are not already logged in, you will need to click "EXHIBIT HALLS" and browse for us).
Booth Hours:
Live from 11:00 AM to 3:00 PM
Eastern Time
January 21-22, 2021 and January 25-29, 2021
Registrants can also access documents/videos in the booth or leave business cards/messages 24 hours a day from January 21 through February 19, 2021.
Happy Holidays
Happy Holidays and Happy New Year to you and yours from all of us at Caliper. We will miss seeing you in person and hope that we can resume face-to-face meetings at some point in 2021.
©2021 Caliper Corporation. All Rights Reserved. TransCAD and TransModeler are registered trademarks of Caliper Corporation.