

Winter 2019-2020
Welcome!
Welcome to our latest transportation newsletter. During the past year, we have continued to work on interesting projects involving connected and automated vehicles, activity-based models, simulation-based dynamic traffic assignment, and transportation performance measurement as well as on enhancing the software tools that are available to planners and engineers for the successful realization of their work. New versions of both TransCAD and TransModeler were released in 2018, and development of the next versions is underway. As usual, we will be exhibiting at TRB and look forward to seeing as many of you as possible.
Integration of TransModeler & HCS Software
In collaboration with the McTrans Center at the University of Florida, Caliper has made it possible to launch TransModeler directly from the HCS™ software in order to animate and simulate HCS7Streets module scenarios. This capability is available to all TransModeler users, but those who upgrade to HCS 7.7 can get a free one-year license for TransModeler SE and access to inexpensive upgrades thereafter. As a result, thousands of transportation engineers who use HCS will have free access to traffic simulation tools.
TransModeler SE is low-cost and high-fidelity traffic microsimulation software designed to put powerful, easy-to-use microsimulation and 3D visualization at every traffic engineer’s disposal. A subset of the full TransModeler, SE integrates traffic simulation with HCM analysis, traffic impact analysis (TIA), and signal optimization. It serves as a bridge from HCS analysis to a range of more advanced traffic analysis and microsimulation applications. The full functionality and flexibility of TransModeler SE is available to users who wish to extend their HCM analysis to more detailed and more accurate evaluation of a broader variety of geometric designs, from single-lane and multi-lane roundabouts to alternative intersection and interchange designs, such as RCUT, MUT, CGT, CFI, DDI, and more.
Simulation is a useful addition to HCM analysis because it provides insight into finer time intervals and easily provide multi-period results. In contrast, HCM/HCS methods are typically based on average values for a 15-minute interval and are thus inherently approximate in nature. Simulations are more effective in exploring variations to input values and solution parameters, calculating refined and more specific measures of effectiveness, optimizing some solutions, and providing visual insights and confirmation about traffic behavior. Importantly, TransModeler can use origin-destination trip matrices as input, thus providing more consistent and realistic analysis than one that relies solely on turning movement counts, which may often be inconsistent with one another or with reasonable travel paths.
Both TransModeler versions (Full and SE) offer a robust, simulation-based traffic signal timing optimization toolset. Simulation-based optimization provides the same objective function choices as deterministic tools (e.g., delay minimization, progression maximization, etc.) but is more sensitive to cyclical variations, such as turn lane queue spillback and mid-block delays in the development of optimal cycle lengths, phasing schemes, and phase durations.
Brilliant 3D Animation of Traffic Simulations
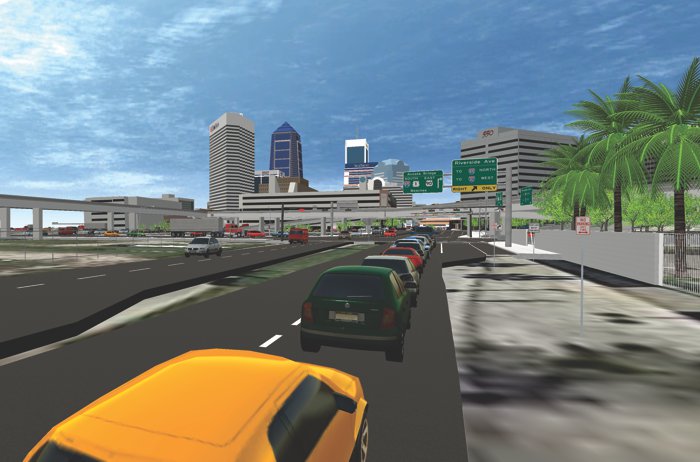
In the latest version of TransModeler, 3D animation is faster, simpler, and more captivating. Now integrated with Unity™, a popular 3D platform for video game developers, you can quickly design the environment surrounding the roads and traffic you are simulating. TransModeler 5.0 includes models of vehicles, buildings, trees, and other objects that you can use to create a 3D scene in a matter of minutes. Use aerial imagery to lay the groundwork automatically, and other commonly available GIS data, such as digital elevation models and building footprint polygons, to develop a realistic 3D depiction of the natural and built environment. With built-in flight path and movie-recording tools, you can script and record stunning fly-over movies that highlight perspectives and points of interest that best convey the project to your audience. Used together, TransModeler and Unity are a potent combination for visualizing traffic.
Why DTA?
Traffic conditions vary significantly over short time intervals making static models a poor choice for understanding or predicting traffic. Dynamic traffic assignment (DTA) can reflect traffic in a much more realistic fashion by incorporating traffic signals, queues and spillback, dynamic pricing, and other new technologies. Caliper has been researching and implementing dynamic traffic models for many years and has focused on simulation-based DTA as the most promising way forward. A summary of this work can be found at https://www.caliper.com/pdfs/Yang_et_al_2017_Large-Scale_DTA_WCTR_TR_Procedia.pdf.
Simulating Connected and Automated Vehicles

Microsimulation is the ideal tool for analyzing the operations and impacts of connected and automated vehicles (CAV). We have been working to expand the tools in TransModeler to simulate CAV scenarios and capabilities.
In 2018, Caliper completed a project with Resource Systems Group (RSG) for the Federal Highway Administration (FHWA) that called for the integration of an ABM with a DTA and subsequent application of the models to analyze connected and automated vehicles. Specifically, the research project involved the application of exploratory modeling and analysis (EMA) techniques in a transportation planning context to study the potential impacts CAVs may have on a metropolitan area's surface transportation system. A microsimulation-based DTA for Jacksonville, FL in TransModeler was integrated with the MPO's ABM and was subsequently enhanced to simulate CAV operations and various supply scenarios (e.g., exclusive CAV lanes). The integrated ABM-DTA was then used to evaluate a range of CAV scenarios under varying assumptions regarding the level CAV adoption. TransModeler was also enhanced in the project to simulate the operation of a transportation network company (TNC) fleet. You can refer to the project final report found at https://www.caliper.com/press/model-impacts-of-cavs-with-abm-and-dta.pdf for further details.
Caliper's work to expand the CAV simulation capabilities in TransModeler continued with a project for the Ohio Department of Transportation (ODOT). The ODOT project began with a literature review to establish the most current understanding of CAV operations and techniques for simulating them. The study will continue into 2019, when TransModeler will be enhanced in various ways informed by the literature review and then used to simulate how CAVs might impact operations on sensitive corridors in Ohio.
DTA Projects Progress
Caliper pioneered and continues to extend the scale and scope of region-wide dynamic traffic simulations and simulation-based dynamic traffic assignments. In the past, we developed a microsimulation-based DTA of central Phoenix that was subsequently expanded to include all of Maricopa and Pinal Counties. This model simulates millions of daily trips at high fidelity. We also built and calibrated a microsimulation of the six-county planning network used for modeling by the North Florida (Jacksonville) Transportation Planning Organization.
Caliper has been working on two projects to develop new regional microscopic and mesoscopic DTA models in TransModeler. The first is a microscopic simulation-based DTA for the Regional Transportation Commission of Southern Nevada (RTCSV), the MPO for Las Vegas, and will span all of Clark County, NV. The second, for the Michigan DOT (MDOT), will be a mesoscopic simulation-based DTA that will span a significant portion of the Southeast Michigan Council of Governments' (SEMCOG) seven-county region including Detroit and Ann Arbor. The mesoscopic DTA for MDOT will be used to support microscopic simulation models of major freeway corridors in Detroit where megaprojects and maintenance-of-traffic strategies are being planned.
People often do not realize that one-time simulations without iterative updates of travel times and route choices are fundamentally inconsistent. This is because the dynamic travel times assumed at the beginning of the simulation will be different than those experienced in the simulation run, making the model inputs and outputs inconsistent and thus unreliable. A solution of iterative simulations is necessary to achieve a more reasonable and reliable prediction. Thus, the motivation for a DTA is more broadly based than commonly thought.
Travel Demand Modeling Tools and Techniques
We continue to expand and improve upon the set of
travel demand modeling tools that are available in TransCAD. Several new
tools are described below.
A New Population Synthesizer
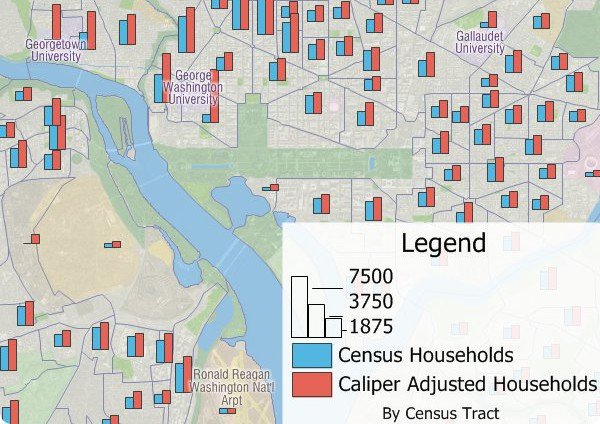
In conjunction with several projects supporting disaggregate travel demand models, Caliper has developed a new and improved population synthesis procedure for TransCAD. Synthetic populations are used in disaggregate models in which detailed microdata about households and individuals are needed but for which there is insufficient survey data, and which would compromise the privacy of citizens even if the real data were available. A synthetic population is a dataset that, when tabulated at a more aggregate level, will match Census or other known or estimated marginals.
Given that travel is manifested elementally at the individual level, a synthetic population should get individual and household characteristics correct at the TAZ or lower geographic level. Modeling only household characteristics without the individual characteristics will compromise any modeling effort. Consistent matching at several levels of geography is needed to capture regional travel on an origin-destination basis, and should also reflect localized demographics. The new population synthesizer accomplishes these tasks and has, in our testing, outperformed other solutions. For more information, please contact Rama Balakrishna (rama@caliper.com) or Srini Sundaram (srini@caliper.com).
Estimating Household Size Distributions
Household size distributions are critical inputs to travel demand models but may not be correctly derived from U.S. Census data. The Census counts people at their geographic locations, and when several unrelated people live at the same address they are reported as one household with a number of residents. A confusing array of data is reported. In both the Census SF1 2010 file and in 2017 ACS, the following tabulations are provided down to the Census tract level:
- People in Family Households
- 2 person Family Households
- 3 person Family Households
- 4 person Family Households
- 5 person Family Households
- 6 person Family Households
- 7+ person Family Households
- Non-relatives in Family Households
- Unmarried Partners (including same-sex couples) in Family Households - People in Non-Family Households
- Unmarried Partners (including same-sex couples) in Non-Family Households
There is also extensive information on people residing in group quarters in the 2010 Census, which has the tabulations below:
- People in Group Quarters: College
- People in Group Quarters: Military
- People in Group Quarters: Navy Ships
- People in Group Quarters: Other
- People in Group Quarters: Homeless
- People in Group Quarters: Group Homes
- People in Group Quarters: Residential Treatment
- People in Group Quarters: Merchant Ships
- People in Group Quarters: Workers’ Group Living Quarters
- People in Group Quarters: Other Other - People in Group Quarters: Institutionalized
Using this information, Caliper has developed a corrected data set of household size distributions for Census Tracts and Block Groups. In general, these data reflect a much greater incidence of one-person households than would ordinarily be believed to exist. These new data will be available to TransCAD users in the near future.
Visualizing Data in Time and Space
Often it is convenient to view traffic flow attributes such as speeds both in time and in space. Below is an example of a chart produced by TransCAD showing speeds along a corridor by time of day.
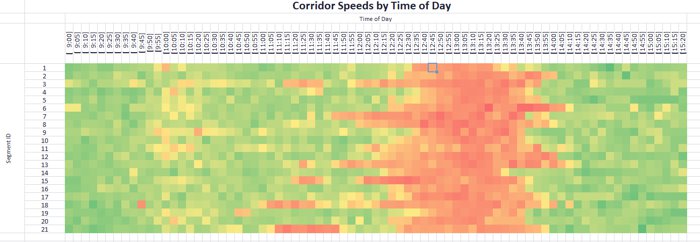
Each row in this chart corresponds to a different segment of a corridor, and each column indicates the speed during its specified time interval on that segment. This same chart can be used to visualize the NPMRDS data.
Destination Choice Model Estimation
A critical component of most modern travel demand models are the destination choice models. These may be estimated variously for trips or tours and for numerous travel purposes or activities. Destination choice models are also often the weak link in travel models due to lack explanatory power, which is often the result of a lack of detailed data on destination characteristics and locations.
Destination choice models can also be cumbersome to estimate due to their large number of destination alternatives and the difficulty of data preparation prior to estimation in a statistical package.
To provide better support for this important process, we have added destination choice model estimation to TransCAD. This initial support is for multinomial logit, which is the most common destination choice model in use. Importantly, a new user interface makes it much easier to specify destination choice models and to prepare the necessary inputs for model estimation.
Some New Data for Modeling
In the hopes of addressing the need for additional data on destinations, we have also been able to identify and make available a variety of new datasets that are of interest to our users. One example of these is the Medicare database, which has the locations of every health care provider in the U.S. that receives federal funds. These locations are identified by type so that hospitals, clinics, and physician locations are included. Caliper also develops its own ZIP Code polygon layer and ZIP Code data on business activity that can be approximated to other geographies. Perhaps of even more utility, the HERE data that are optionally available from us make it possible to identify store locations and many other landmarks, and to aggregate these data to TAZ layers.


Using R with TransCAD and Maptitude
We have never aspired to provide a full statistical analysis package inside of TransCAD. Rather, we have focused on providing those tools that are integral to travel demand modeling and to make them as convenient and as efficient as possible. However, there are many times when additional statistical tools will be useful to analysts. An excellent means of adding these tools is through R.
R is a powerful programming language for data science. In addition to excelling at data manipulation, R provides easy access to a wide variety of statistical functions and powerful graphical capabilities. Fortunately, running R scripts from Caliper's GISDK language is a straightforward process. The RunProgram() function can be used to call R like so:
RunProgram(
"C:\\Program
Files\\R\\R-3.5.0\\bin\\RScript.exe",
"C:\\my_r_script.R",)
R can also be used for reporting in HTML, PDF, or Word.
In the future, we will be integrating R functionality directly into TransCAD.
New, Simplified Scripting Framework
The new version of TransCAD 8 includes an object-oriented framework to make scripting of transportation models easier, more efficient, and more readable. This enhancement to the GISDK simplifies the creation of transportation models, along with data and matrix operations. This framework is integrated with Microsoft’s free programming editor, Visual Studio Code, as a downloadable extension from the Visual Studio Marketplace.
New Caliper Staff
Recently, there have been four significant additions to our transportation staff. These individuals are all playing key roles in the evolution of our products and services.
 Dr. Tom Creasey joined Caliper in October 2018
as Vice President of Transportation Engineering. Tom is an
established leader in transportation and an industry veteran with
more than 35 years of experience as a practitioner, researcher, and
educator at major transportation organizations in the United States.
Tom currently serves as the Chairman of the Transportation Research
Board's Highway Capacity Committee and is a recognized
international expert in transportation. At Caliper, Tom will
direct strategic studies and advise government agencies on
congestion management strategies; guide major transportation
research, planning, and traffic engineering projects; and play a key
role in charting the evolution of Caliper's industry-leading
software products for traffic simulation and traffic management.
Dr. Tom Creasey joined Caliper in October 2018
as Vice President of Transportation Engineering. Tom is an
established leader in transportation and an industry veteran with
more than 35 years of experience as a practitioner, researcher, and
educator at major transportation organizations in the United States.
Tom currently serves as the Chairman of the Transportation Research
Board's Highway Capacity Committee and is a recognized
international expert in transportation. At Caliper, Tom will
direct strategic studies and advise government agencies on
congestion management strategies; guide major transportation
research, planning, and traffic engineering projects; and play a key
role in charting the evolution of Caliper's industry-leading
software products for traffic simulation and traffic management.
 Michael
Armstrong joined Caliper in February 2018 as a
Transportation Engineer. Michael, who has Bachelor’s and Master’s
degrees in civil engineering from the University of Florida, has
several years of traffic consulting experience in the private
sector, serving clients at city and state DOTs nationwide. His
experience includes microsimulation-based feasibility and design
studies, crash history and safety studies, signal timing
optimization, traffic impact studies, NEPA planning documentation,
and ITS design. Having previously worked at McTrans at the
University of Florida, Michael has expert knowledge of the HCS
software and has been a key person bringing about the integration of
HCS and TransModeler. Michael is a registered professional engineer
in North Carolina and Florida.
Michael
Armstrong joined Caliper in February 2018 as a
Transportation Engineer. Michael, who has Bachelor’s and Master’s
degrees in civil engineering from the University of Florida, has
several years of traffic consulting experience in the private
sector, serving clients at city and state DOTs nationwide. His
experience includes microsimulation-based feasibility and design
studies, crash history and safety studies, signal timing
optimization, traffic impact studies, NEPA planning documentation,
and ITS design. Having previously worked at McTrans at the
University of Florida, Michael has expert knowledge of the HCS
software and has been a key person bringing about the integration of
HCS and TransModeler. Michael is a registered professional engineer
in North Carolina and Florida.
 Kyle Ward joined Caliper as a Senior Data
Scientist and Senior Transportation Modeler in October after 5 years
of experience at WSP/PB and 5 years as a modeler at the Raleigh, NC
MPO. Kyle has a BS in Industrial Engineering and an MS in Civil
Engineering from North Carolina State. At Caliper, Kyle is a key
person developing travel models for various regions and is working
on programmatic approaches to interesting problems like dynamic OD
matrix estimation. Mr. Ward has additional skill sets in machine
learning, general data science, and R that will be brought to bear
in Caliper software and service enhancements.
Kyle Ward joined Caliper as a Senior Data
Scientist and Senior Transportation Modeler in October after 5 years
of experience at WSP/PB and 5 years as a modeler at the Raleigh, NC
MPO. Kyle has a BS in Industrial Engineering and an MS in Civil
Engineering from North Carolina State. At Caliper, Kyle is a key
person developing travel models for various regions and is working
on programmatic approaches to interesting problems like dynamic OD
matrix estimation. Mr. Ward has additional skill sets in machine
learning, general data science, and R that will be brought to bear
in Caliper software and service enhancements.
 Dr. Bruce Spear joined Caliper at the beginning
of 2018 as a Senior Adviser and noted expert on transportation data
and transportation GIS. Bruce had a long and distinguished career at
U.S. DOT working at the Volpe Center, the Bureau of Transportation
Statistics, and FHWA followed by considerable experience at
Cambridge Systematics. At Caliper, Bruce is working on creating new
data sets for the transportation community, methods for improving
and correcting HPMS submittals, and on tools for performance
monitoring.
Dr. Bruce Spear joined Caliper at the beginning
of 2018 as a Senior Adviser and noted expert on transportation data
and transportation GIS. Bruce had a long and distinguished career at
U.S. DOT working at the Volpe Center, the Bureau of Transportation
Statistics, and FHWA followed by considerable experience at
Cambridge Systematics. At Caliper, Bruce is working on creating new
data sets for the transportation community, methods for improving
and correcting HPMS submittals, and on tools for performance
monitoring.
From the Archives: Roadway Package Systems/FedEx Ground

One of Caliper’s first projects was a large market research and demand project for the Roadway Services Company to forecast and validate their business prospects for a new ground transportation system for packages in competition with UPS, who in the mid-80s had a virtual monopoly on those freight services. Caliper designed and conducted the pre-launch study for the Roadway Package System (RPS), which is now known as FedEx Ground. The study utilized stated preference models of shipper choice of carrier for packages and other suitable freight and predicted that RPS would be successful. Pricing, service area coverage, and tracking features were examined to help define and support the business strategy for market entry. Fortunately, our prediction that their service would be successful in Roadway’s launch configuration proved to be correct, and RPS and subsequently FedEx Ground continued to grow in traffic volumes and revenues.
Upcoming Training
| Class | Location | Date |
| TransCAD GISDK | Newton MA | Feb. 12-13 |
| Travel Demand Modeling with TransCAD | Newton MA | March 4-8 |
See You at TRB!
As usual, Caliper will be exhibiting at TRB and we will be pleased to show you the latest developments in our software and project work. The exhibit hours are as follows:
- Sunday, January 13: 4:00 PM - 7:00 PM
- Monday, January 14: 9:00 AM - 4:00 PM
- Tuesday, January 15: 9:00 AM - 4:00 PM
Caliper will also have a hospitality suite (2-042) in the Marriott Marquis open Monday, Tuesday, and Wednesday evenings from 5PM to 8PM. We look forward to seeing you there.
Season’s Greetings from All of Us to You and Yours!
©2019 Caliper Corporation. All Rights Reserved. TransCAD and TransModeler are registered trademarks of Caliper Corporation.