Maptitude Help / Geographic Analysis Tools / Creating Buffers
Creating Buffers
A buffer (also known as a band) is an area of a specified width that surrounds one or more map features. You create bands using the Tools>Analysis>Buffers command. This command lets you create any number of buffers around any number of map features. To use it, you choose the map features around which the buffers should be built, and enter the information about the size of the buffers you want to create.
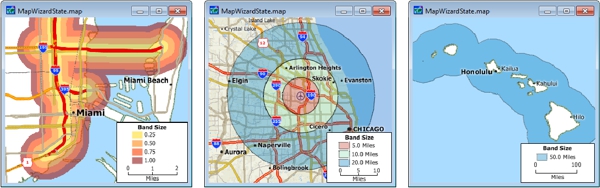
1/4, 1/2, 3/4, and 1 mile buffers from highways (left), 5, 10, and 20 mile buffers from an airport (center), and 50 mile buffer from the shore (right)
In the preceding examples the buffers were built to a particular width or set of widths. Maptitude can also figure out how to create buffers so that their sizes reach a particular target:
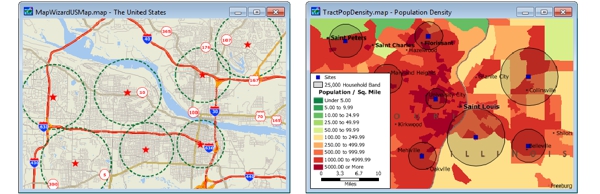
Each buffer in the map on the left includes 100 total miles of roads. Buffers are smaller where the road segments are more dense. Each buffer in the map on the right contains 25,000 households.
The Buffers command creates a new map layer containing the buffers and saves the features in a new geographic file. Maptitude also adds the new area layer to the map and creates a color theme so that the buffers are easy to see. You can change the way buffers are displayed, add labels, or compute overlays to estimate the attributes of the areas.
 |
For a video tutorial see: (Internet connection required) |
Setting Buffer Size
You can set the size of the buffers in four different ways:
- Create evenly-spaced buffers by entering a low value, a high value, and a step size. For example, build buffers from 0 miles to 50 miles with a band width of 10 miles, and you get five evenly spaced buffers around each feature.
- Type a list of sizes to create one buffer of each size. For example, ask for bands at 2.5 miles, 5 miles, 10 miles, 25 miles, and 50 miles, and you get 5 buffers of varying width around each feature.
- Create buffers of variable sizes around each feature, where the size of each band is determined by the value of some attribute of each feature. For example, build buffers based on transmitter range around towers in a point layer where the range is stored in a field in the point layer.
- Create buffers so that they contain a particular value of an attribute such as population, income, or area. The width of each buffer is computed by Maptitude on the fly.
Using Buffers Inside Areas
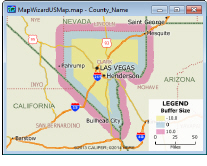 Buffers can also be created inside the boundary of an area. For example, you might want to see the buffer that is within five miles of a state boundary, to look at how an increase in the gasoline tax might affect gas stations within five miles of the border.
To create buffers inside an area feature, enter buffer sizes that are less than zero instead of greater than zero. For example, if you asked for buffers around Clark County in sizes -10 miles, 0 miles, and 10 miles, you would get this result shown on the right.
Buffers - Merged or Separate
When you build buffers around a single feature, Maptitude creates one area for each buffer you request. When you build buffers around two or more features, you have a choice of whether the buffers should be separate or joined. Maptitude normally creates buffers joined together. When you create variable-sized bands, Maptitude always creates a separate buffer for each feature.
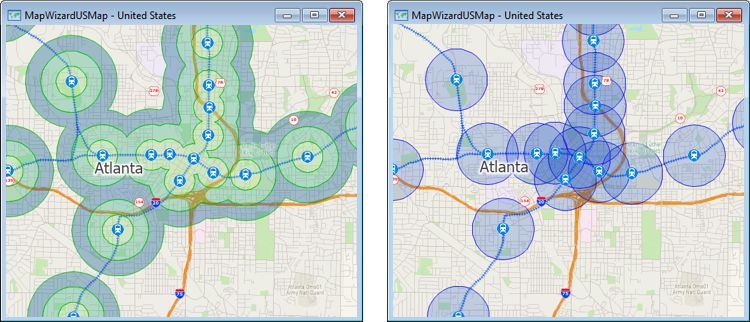
The buffers on the left are merged allowing you to compare the demographics of the population that lives close to a station to the population that lives farther away. The buffers on the right are separate allowing you to compare the characteristics of the population that lives near one station to the population that lives near another station.
Buffers - Individual or Cumulative
You can choose to calculate demographics for the buffers you create. You can choose whether the demographics are for the individual buffers or cumulative as illustrated here:
|
|
|
|
|
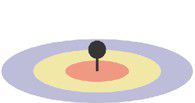
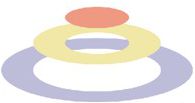
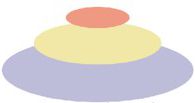
If you create three buffers at 1-mile intervals like these |
...you can calculate the demographics in each buffer (i.e., within 0-1, 1-2, and 2-3 miles)... |
...or you can calculate the cumulative demographics for the buffers (i.e., within 0-1, 0-2, and 0-3 miles) |

- Choose the layer to use in creating the buffers from the drop-down list on the Standard toolbar.
- Choose Tools>Analysis>Buffers or click
 Buffers in the analysis tools drop-down on the Standard toolbar to display the Buffers dialog box.
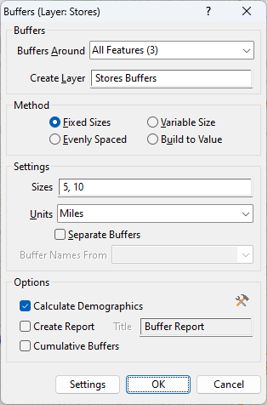
- Choose whether to build the buffers around all features, the features visible in the map, or a selection set from the Buffers Around drop-down list.
- Enter a name for the new buffers layer in the Create Layer box.
- Choose the size of the buffers you want to build, according to the table:
| For this method... | Do this... |
|---|---|
| Fixed Sizes | Type the sizes of the buffers you want, separated by spaces or commas, in the Sizes box, and choose the Units from the drop-down list. |
| Evenly Spaced | Type a low value in the From box, a high value in the To box, and an interval in the By box, and choose the Units from the drop-down list. |
| Variable Size | Choose the field containing the buffer size from the Sizes drop-down list and choose the Units from the drop-down list. |
| Build to Value | Choose the source layer from the Layer drop-down list, choose the field that contains the values of interest from the Field drop-down list, and type the target values you want, separated by spaces or commas, in the Values box. |
- Choose whether to create merged or separate buffers as follows:
| To create... | Do this... |
|---|---|
| Merged buffers | Remove the check from the Separate buffers box. |
| Separate buffers | Check the Separate buffers box and, if you want to identify the feature around which the buffers are built, choose a field that contains the name from the Buffer Names from drop-down list. |
- To calculate demographics for the buffers, check the Calculate Demographics box, choose whether to create a report of the demographics with the Create Report box, and choose whether to calculate demographics for the individual rings or cumulative rings with the Cumulative Buffers box.
To specify the attributes to calculate and/or count features in the buffers, click to display the Demographic Settings dialog box and make choices as follows:
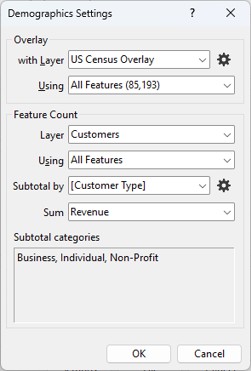
- Choose a reference layer with demographics and the features to use from the with Layer and Using drop-downs list. Typically Maptitude will choose an appropriate layer and demographic fields to use. See To Change the Aggregation Method when Calculating Demographics for information on changing these fields.
- To count features the features in each buffer, choose the layer whose features you want to count and the features to use from the Layer and Using drop-down lists.
- To subtotal the counted features, choose a field to use for grouping and the category types to group or choose None to get the total count of features without subtotaling. For example, you could use the "Type" field in the landmark layer and choose to find the number of restaurants and schools within the buffers.
- Choose a field from the feature count layer to aggregate from the Sum drop-down list. For example, you could calculate the total revenue of customers within the buffers.
- Click OK to return to the Buffers dialog box.
 |
TIP: You can customize a report with your company name by choosing Edit>Preferences and making changes on the Reporting tab. |
|
TIP: Regardless of whether you choose to calculate demographics, you can export demographic overlay data and other information to Excel by making the resulting buffer layer the working layer and clicking |
 on the Standard toolbar.
 - Click OK.
Maptitude creates a new layer containing the buffers and adds the new layer to the map. If you chose to produce an overlay, Maptitude creates the table and displays the results in a joined view. If you chose to create a report, Maptitude generates the report and displays it in a new window. Reports can be printed, saved, exported, and emailed. Close the report window when you are done.
Try It Yourself: Building Buffers
1. Choose File>Open Workspace or click  on the Standard toolbar, then open the Gaps workspace in the Tutorial folder. You want to show where there are gaps in the service areas of your chain of restaurants. In-store surveys have shown that people will drive 5 and sometimes 10 miles to eat at your restaurants.
2. Right-click on Store in the Display Manager and choose Make Working Layer.
3. Choose Tools>Analysis>Buffers or click Buffers in the analysis tools drop-down on the Standard toolbar to display the Buffers dialog box.
4. Click the Fixed Sizes radio button and type “5, 10” in the Sizes edit box.
5. Click OK. Maptitude creates the buffers and adds them to the map, showing the gaps in the service areas.
6. Choose File>Close Workspace and click Don't Save to close the workspace without saving any changes.
©2026 Caliper Corporation