Maptitude Help / Managing Geographic Files / Exporting to Excel
Exporting to Excel
Maptitude lets you quickly export useful data about an area of interest to an Excel file. You can export data for areas in a map layer or for a shape that you create with the drawing tools.
There are several ways you can define the area you want to study:
- Draw an area on the map using the Rectangle
 , Radius
  , Oval
  , or Shape
  drawing tools.
 - Choose all features or a selection set in a standard (.DBD) area layer such as those created by the Buffers, Overlay, Merge by Value, Merge by Sets, Areas of Influence, Weighted Center, or Drive Time Rings geographic analysis tools, or in a Shapefile or MapInfo TAB area layer.
- Choose a selection set in a compact (.CDF) area layer such as the postal code or state layers included with Maptitude.
 |
NOTE: To export territory layers to Excel, see To Export a List of Map Features and the Territories to Which They Belong. |
When you export your chosen area to Excel, the resulting file will have separate sheets containing the following information:
- Overlay demographics for the area. The demographics will vary depending upon the Country Package that you have installed. For example, if you are using the U.S. Country Package, the demographics will include income, population, gender, age, race, households, and housing units.
- A list of the features in any point layers (excluding those protected by the HERE license, such as landmarks) that are within the boundaries of your area of interest and their associated data fields. In addition, if you used the Radius or Oval tools, the straight-line distance and drive time to the center is also provided.
- A sheet with data for any area layers on which a color, chart, and/or size theme is present. These sheets will contain data from the themes for every area feature that is partially or entirely within the area of interest. Depending upon the nature of the data, this sheet may contain the original (“Copy”) and a “Proportional” value. The “Proportional” value will be smaller for areas that are partially within the freehand shape.
For example, consider the following map that contains a point layer of customers and a color theme of average sales by ZIP Code:
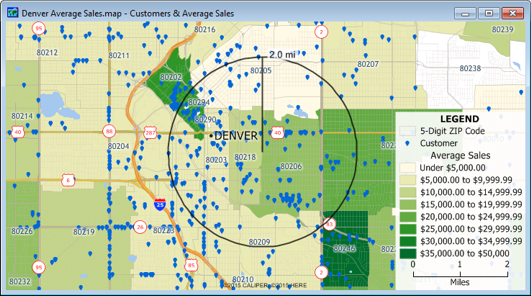
You could use the Radius tool to draw a circle on the map. If you export this 2.0 mile radius circle, your Excel file will contain the following:
- One sheet with the income and population demographics for the population within that circle.
- A second sheet with all of the customers that are located within that 2-mile radius, their associated data, and their straight-line distance and drive time to the center of the circle.
- A third sheet with average sales values for the ZIP Codes that are located partially or fully within that circle.
 |
For a video tutorial see: (Internet connection required) • Using Maptitude in Conjunction with Microsoft Excel: Attaching Excel data to maps, geocoding Excel data, exporting to Excel using the drawing tools, exporting analysis results to Excel, and joining Excel data to a map layer • Creating Buffers with Maptitude: Using circular rings and buffers to estimate populations around features |
 To Configure Editing for Excel
- Choose Tools>Reports>Settings to open the Reporting page of the User Preferences dialog box.
- Modify your Export to Excel settings as follows:
| Option... | What it does... |
|---|---|
| Export only those point features within map window | When checked, Export to Excel only includes features that are visible within the map window and ignores hidden features (e.g., features in selection sets that are hidden) or features that are outside of the area visible in the map window. When unchecked, Export to Excel includes features that are visible, hidden, or beyond the map scope. |
| Calculate area weighted sum ("Proportional") overlay fields | When checked, Export to Excel includes both copy and proportional overlays from area color themes. When unchecked, Export to Excel just copies overlays from area color themes. If proportional overlays are not required, unchecking this option may provide faster results. |
| Calculate drive time and distance fields | When checked, Export to Excel calculates drive time and distance fields for point layers when using the Oval or Radius tools. When unchecked, Export to Excel does not calculate drive time or distance fields. If distances are not required, unchecking this option may provide faster results. |
| Allow me to choose the layers included in the report | When checked, Export to Excel will prompt you to choose which point layers and/or area layers with themes to include in the Excel file. When unchecked, Export to Excel will include all point layers and area layers with themes. |
- Click OK.
Maptitude will use the options you chose when you next use the Export to Excel command.
For information on the other options on the Reporting page, see Edit Preferences: Reporting.
To Export to Excel Using the Freehand Tools
- Open or create a map that optionally contains a standard point layer and/or an area layer with one or more themes.
- Use the Rectangle , Radius , Oval , or Shape drawing tools to create a freehand area on the map. For more information on using the drawing tools see Adding Freehand Items to a Map.
- Right-click on the shape you drew in step 2 and choose Export to Excel to display the Save As dialog box.
- Enter a name for the Excel file and click Save.
Maptitude exports the data and opens the new file in Excel. The Excel file will contain a sheet with overlay demographic data for the area you drew. If any point layers were present, it will also contain a sheet with data for the features within the area you drew. If any area layer themes were present, it will also contain a sheet with data used in the theme(s).
|
NOTE: By default, the Excel file will include all of the features in all of the point layers (and calculated distances if you are using the Radius or Oval tools), demographic overlay data, and proportional values for areas with color themes. You can modify these defaults as described in To Configure Editing for Excel above. |
To Export to Excel from a Standard (.DBD), Shapefile, or TAB Area Layer
- Open a map that contains an area that you want to study, such as a buffer or drive-time ring.
- Choose the area layer from the drop-down list on the Standard toolbar to make it the working layer.
- Choose Tools>Reports>Export to Excel or click
 on the Standard toolbar to display the Save As dialog box.
 - Enter a file name and click Save.
Maptitude exports the data and opens the new file in Excel. The Excel file will contain a sheet with overlay demographic data for the area(s). If any point layers were present, it will also contain a sheet with data for the features within the area(s). If any area layer themes were present, it will also contain a sheet with data used in the theme(s).
|
NOTE: By default, the Excel file will include all of the features in all of the point layers, demographic overlay data, and proportional values for areas with color themes. You can modify these defaults as described in To Configure Editing for Excel above. |
To Export to Excel from a Selection Set on an Area Layer
- Open a map that contains an area that you want to study.
- Choose an area layer from the drop-down list on the Standard toolbar and select the features that define your area of interest.
- Click
 in the Selection Management drop-down on the Standard toolbar to display the Save As dialog box.
- Enter a file name and click Save.
Maptitude exports the data and opens the new file in Excel. The Excel file will contain a sheet with overlay demographic data for the area(s). If any point layers were present, it will also contain a sheet with data for the features within the area(s). If any area layer themes were present, it will also contain a sheet with data used in the theme(s).
|
NOTE: By default, the Excel file will include all of the features in all of the point layers, demographic overlay data, and proportional values for areas with color themes. You can modify these defaults as described in To Configure Editing for Excel above. |
©2026 Caliper Corporation