Maptitude Help / Surface Analysis Tools / Performing Terrain Analysis
Performing Terrain Analysis
To do terrain analysis you must first prepare the terrain with the Tools>3D>Terrain Analysis Toolbar command. A grid layer requires very little preparation, but for a point layer Maptitude must create the triangulated irregular network (TIN). After the terrain is prepared, you can:
- Calculate the elevation at a point
- Draw an elevation profile between two points
- Do visibility analysis
- Create contours as a line or area geographic file
- Create a 3D map
- Find the shortest path over terrain (on a Grid layer only)
You can also export the TIN for a point layer into two different formats:
Preparing for Terrain Analysis
To analyze a terrain based on a point layer, Maptitude must create the triangulated irregular network (TIN). Maptitude can support multiple levels of interpolation during the creation of a TIN to smooth contour lines during contour generation. Interpolation creates new “height” values between sample points. Level 0 does no contour smoothing, while levels 1, 2, and 3 provide increasing levels of interpolation and smoothing. You can also choose to outline the TIN so that you can see the extent of the terrain.
To analyze a terrain based on a grid layer, you just need to tell Maptitude what field to use as the elevation values. Once the terrain is prepared, Maptitude displays the Terrain Analysis toolbar. After closing the toolbar, Maptitude must prepare the terrain again before you can use the toolbar.
You can only do terrain analysis on one layer at a time in a single map. If you want to do terrain analysis on another layer or with another map, first close the Terrain Analysis toolbar, then make the other layer the working layer and choose the Tools>3D>Terrain Analysis Toolbar command.
 To Prepare for Terrain Analysis Using a Point Layer
- Open a point geographic file, or choose a point layer in the current map.
- Choose Tools>3D>Terrain Analysis Toolbar to display the Terrain Analysis dialog box.
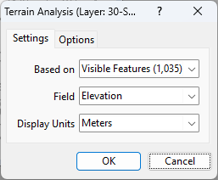
- Choose whether to use all features, visible features, or a selection set from the Based on drop-down list.
- Choose the field that contains the elevation values from the Field drop-down list.
- Choose the elevation units from the Display Units drop-down list.
- Click the Options tab to display the Options page.
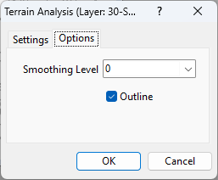
- Choose a smoothing level from 0 (no smoothing) to 4 (maximum smoothing) from the drop-down list and check the Outline box to draw a line around the extent of the terrain.
- Click OK.
Maptitude creates a TIN data structure and displays the Terrain Analysis toolbar.
To Prepare for Terrain Analysis Using a Grid Layer
- Open a grid geographic file, or choose a grid layer in the current map.
- Choose Tools>3D>Terrain Analysis Toolbar to display the Terrain Analysis dialog box.
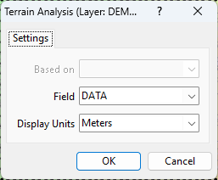
- Choose the field that contains the elevation values from the Field drop-down list.
- Choose the elevation units from the Display Units drop-down list.
- Click OK.
Maptitude displays the Terrain Analysis toolbar.
Calculating a Spot Elevation
You can use the elevation tool in the Terrain Analysis toolbar to determine the elevation at a specific geographic location. Maptitude uses the grid layer or the TIN to estimate the height at that location.
To Calculate a Spot Elevation
- Prepare your data for terrain analysis as described in Preparing for Terrain Analysis.
- Click
 in the Terrain Analysis toolbar to activate the Calculate Spot Data tool.
 - Click on a location within the grid layer or TIN.
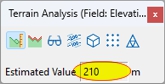
Maptitude displays the estimated elevation in the text box in the Terrain Analysis toolbar.
Creating a Profile Drawing
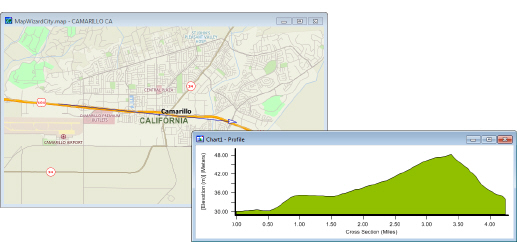
The elevation of the landscape may vary between any two points on the earth’s surface. The terrain can be shown by graphing the elevation at intervals between these two points. Such a graph is usually called a surface profile drawing or profile chart. Using Maptitude you can generate a profile drawing by defining the endpoints of the profile. Maptitude calculates elevation at regular intervals between these two points and displays the profile in a new figure window.
To Create a Profile Drawing
- Prepare your data for terrain analysis as described in Preparing for Terrain Analysis.
- Click
 in the Terrain Analysis toolbar to activate the Show Profile tool.
 - Click on the map at the beginning of the profile line, move the cursor to the end of the profile line, and click again.
Maptitude creates a new area chart in a figure window showing the profile and adds a freehand line to the map to show the location and direction of the profile. If any portion of the profile line is outside the TIN or the grid layer, no profile can be created for that portion of the line, and that portion of the area chart will be blank. You can save the figure window or add it to a layout. You can use the Pointer tool to edit or delete the line.
You can repeat step 2 to create other profiles. If you create another profile, the freehand line for the first profile is deleted.
Doing Visibility Analysis
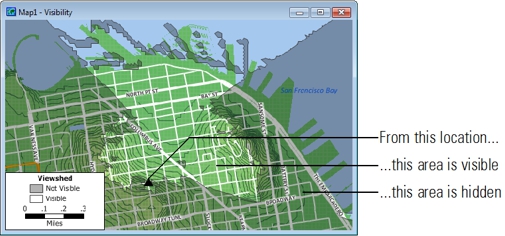
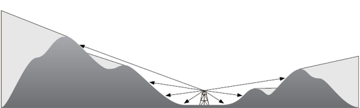
If a terrain is flat, you can see all the way to the horizon. If a terrain has hills and valleys, you can see some parts of the terrain (the viewshed) and other parts are hidden. Maptitude can calculate the areas that you can and cannot see from a specific location. This is called visibility analysis.
If you are evaluating a site for a transmission tower or a similar structure, you need to analyze the visibility from a vantage point above the surface. Maptitude lets you define a height increment to be added to the elevation at that location.
Visibility analysis creates a geographic file that contains two area features, one made up of all the areas that can be seen from your viewpoint (the viewshed) and the other made up of all the areas that are hidden.
To Do Visibility Analysis from a TIN
- Prepare your TIN data for terrain analysis as described in Preparing for Terrain Analysis.
- Click
 in the Terrain Analysis toolbar to activate the Create a Visibility Map tool.
 - Click at a location. Maptitude displays the Visibility Analysis Point dialog box.
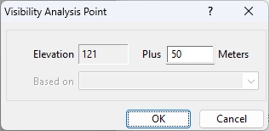
- If you want the viewpoint to be above the surface, type a value in the Plus edit box.
- Click OK.
Maptitude adds a new area layer to the map showing the viewshed, with a color theme that fills the area outside the viewshed with a crosshatch pattern to indicate that it is not visible.
To Do Visibility Analysis from a Grid DEM
- Prepare your grid data for terrain analysis as described in Preparing for Terrain Analysis.
- Click in the Terrain Analysis toolbar to activate the Create a Visibility Map tool.
- Click at a location. Maptitude displays the Visibility Analysis Point dialog box.
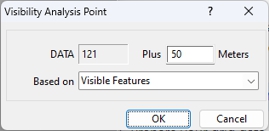
- If you want the viewpoint to be above the surface, type a value in the Plus edit box.
- Choose the features to use from the Based On drop-down list.
- Click OK.
Maptitude adds a new area layer to the map showing the viewshed, with a color theme that fills the area outside the viewshed with a crosshatch pattern to indicate that it is not visible.
Generating Contours
A map may be marked by lines that represent the elevation or height of a data value. These lines, known as contour lines, are imaginary lines that pass though points of equal elevation or height. A contour map typically shows multiple contour lines.
Maptitude supports the creation of contours as either area features or line features. If you create contours as areas, Maptitude will add a color theme to emphasize the contours.
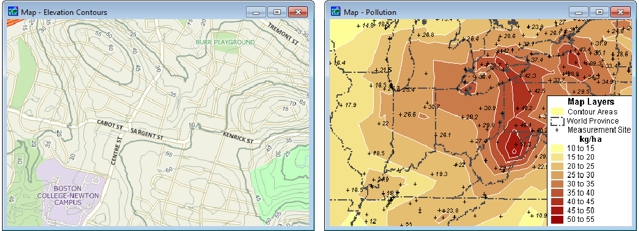
Contours can represent elevations (left) or data values such as air temperature or pollution (right)
Contours are separated by a regular height difference known as the contour interval. Maptitude allows you to choose between automatic and manual definition of the contour interval. If you choose manual definition, you specify the contour interval. The contour interval that is used to display elevation data should be chosen according to the scale of the map and the nature of the terrain being represented.
For line intervals, you can also define a major and minor contour interval. For example, major contour lines may be separated by an interval of 500 feet and, between these lines, minor contour lines may be drawn with an interval of 100 feet. The major contour interval is always a multiple of the minor interval. If you indicate a major contour interval, Maptitude creates a color theme with a bolder line style for major contours, based on the Major field. You can also use the Value field to label the contours with their elevation, and you can use selection sets to further distinguish major and minor contour lines.
To Generate Contours from a Grid DEM
- Prepare your grid data for terrain analysis as described in Preparing for Terrain Analysis.
- Click
 in the Terrain Analysis toolbar to display the Contour Layer dialog box.
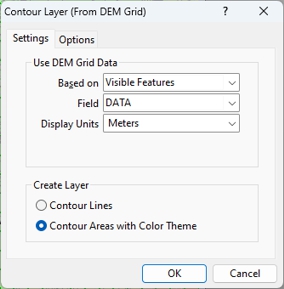
- Choose whether to use all features, visible features, or a selection set from the Based on drop-down list.
- Choose the field that contains the elevation values from the Field drop-down list.
- Choose the elevation units from the Display Units drop-down list.
- Choose whether to create contour lines or contour areas from the Create Layer radio list.
- Click the Options tab.
- Choose Automatic or Manual from the Contour Intervals radio list.
- If you chose manual contour intervals, enter the contour intervals as follows:
| To create... | Do this... |
|---|---|
| Lines | Type a value for the interval in the Minor interval every edit box |
| Lines with major and minor intervals | Type a value for the minor interval in the Minor interval every edit box and a larger value for the major interval in the Major Interval Every edit box |
| Areas | Type a value for the interval in the Interval every edit box |
- Click OK.
Maptitude creates a contour layer and redraws the map to display the contour layer.
To Generate Contours from a TIN
- Prepare your TIN data for terrain analysis as described in Preparing for Terrain Analysis.
- Click in the Terrain Analysis toolbar to display the Contour Layer dialog box.
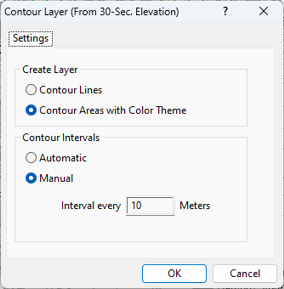
- Choose whether to create contour lines or contour areas from the Create Layer radio list.
- Choose whether to create automatic or manual intervals from the Contour Intervals radio list.
- If you chose manual contour intervals, enter the contour intervals as follows:
| To create... | Do this... |
|---|---|
| Lines | Type a value for the interval in the Minor interval every edit box |
| Lines with major and minor intervals | Type a value for the minor interval in the Minor interval every edit box and a larger value for the major interval in the Major Interval Every edit box |
| Areas | Type a value for the interval in the Interval Every edit box |
- Click OK.
Maptitude creates a contour layer and redraws the map to display the contour layer.
Try It Yourself: Performing Terrain Analysis
1. Choose File>Open Workspace or click  on the Standard toolbar, then open the Contour workspace in the Tutorial folder. Maptitude displays a map that contains a DEM grid layer of elevation data.
2. Choose Tools>3D>Terrain Analysis Toolbar to display the Terrain Analysis dialog box.
3. Choose All Features from the Based On drop-down list, Elevation from the Field drop-down list, and Meters from the Display Units drop-down list.
4. Click OK. Maptitude displays the Terrain Analysis toolbar.
5. Click in the Terrain Analysis toolbar to display the Contour Layer dialog box.
6. Choose Contour Areas with Color Theme from the radio list and click OK. Maptitude creates an area contour layer and displays it on the map with a color theme.
7. Click in the Terrain Analysis toolbar to activate the Calculate Spot Data tool, and click anywhere on the contours. The estimated elevation for the point where you click is shown in the toolbar.
8. Click in the Terrain Analysis toolbar to activate the Show Profile tool, and click on two locations on the contours. Maptitude adds a freehand line to the map and creates a new figure window showing the profile along the line as an area chart.
9. Choose File>Close Workspace and click Don't Save to close the workspace without saving any changes.
Showing 3D Terrain
You can create a 3D map from a terrain. For more information on 3D maps, see Working with Three-Dimensional Maps.
To Show 3D Terrain
- Click
 in the Terrain Analysis toolbar.
Maptitude creates a 3D Surface layer of the visible map, displays it in a 3D View, and displays the 3D Tools toolbar.
Creating a Rectangular Grid DEM from a TIN
Maptitude can create a rectangular grid DEM from a triangulated irregular network (TIN) data structure and save it into a grid geographic file. The number of points that will make up the grid is defined by entering the number of points to be placed on the x and y axis.
To Create a Rectangular Grid DEM from a TIN
- Click
 in the Terrain Analysis toolbar to display the Generate Rectangular Grid dialog box.
 - Type the number of points that will make up the grid in the # Points (X) and # Points (Y) edit boxes.
- Click OK.
Maptitude creates a rectangular grid that covers the same geographic area as the existing TIN and redraws the map to display the grid.
Creating an Area Geographic File from a TIN
 A triangulated irregular network (TIN) is a transient data structure that is created “in the background” to support terrain analysis. When you close the Terrain Analysis toolbar the TIN is deleted. Maptitude allows you to save the TIN as triangular facets in an area geographic file and to display the TIN as a map layer.
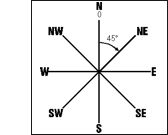
In addition, Maptitude generates a data table that stores the gradient and aspect of each facet in the TIN. Aspect is defined according to the diagram to the right, and describes the compass direction that a triangular plane faces. Gradient and aspect may be used to create effective themes that illustrate the characteristics of a terrain.
To Create an Area Geographic File from a TIN
- Click
 in the Terrain Analysis toolbar to display the Save As dialog box.
Maptitude saves the TIN as an area geographic file and displays the TIN as a map layer.
©2026 Caliper Corporation