Maptitude Help / Geographic Analysis Tools / Using Overlays
Using Overlays
Overlay is a procedure that estimates the attributes of one or more features by superimposing them over other features, and figuring out the extent to which they overlap. You use overlays to estimate the attributes of features in a layer based on data in another map layer. For example, you can use overlays to:
- Compute the total length of all streets inside one or more ZIP Codes
- Estimate the population and average income around potential retail store sites
- Count the number of hospital beds, trauma centers, and medical resources around an earthquake fault
- Count the number of customers and total volume of sales in each sales region
 |
TIP: To compute overlays using several different sizes at once, see Creating Buffers. |
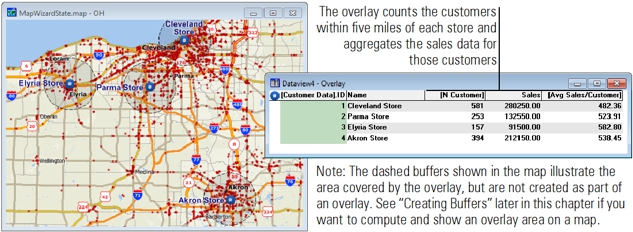
Some overlays are easy to compute. For example, you could use an overlay to count the number of customers within five miles of each store:
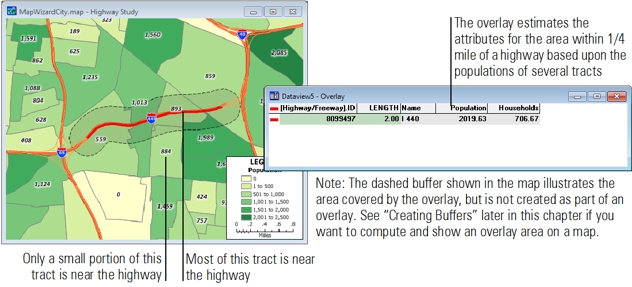
Other overlays are more complicated. For example, you could use an overlay to compute the number of people within a quarter-mile of a highway where noise and pollution are most severe. Maptitude has to figure out the percentage of each Census tract that is inside the quarter-mile buffer in order to make the estimate.
You compute overlays using the Tools>Analysis>Overlay command by following three steps:
- Choose the features for which you want to calculate the data (in the working layer)
- Choose the features whose data you want to tally (in the reference layer)
- Choose options such as the buffer size and attribute settings
The Tools>Analysis>Overlay command creates a new table that contains the attributes of the features in the working layer, and joins the table to the map layer. Overlay can also count the number of features in the reference layer that are at least partly contained within each feature in the working layer. The features in the working and reference layers can be points, lines, or areas. If the features in the working layer are points or lines, you must use a buffer size other than zero.
Maptitude follows certain rules when estimating attributes for the features in the working layer. Maptitude estimates the attributes of area features by adding together the attribute values from features in the reference layer, based on the percentage that they overlap. Some types of data, however, should not be added together. For example, data on Income by ZIP Code should be averaged together rather than added together. To learn more, and to learn how to change the way the calculations are performed, see Combining Attributes.

- Choose the layer whose attributes you want to estimate (the working layer) from the drop-down list on the Standard toolbar.
- Choose Tools>Analysis>Overlay or click
 Overlay in the analysis tools drop-down on the Standard toolbar to display the Overlay dialog box.
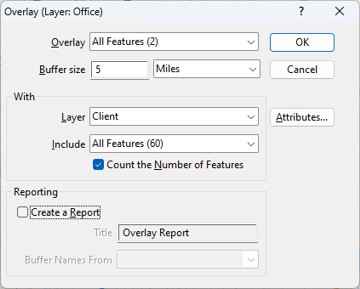
- Choose whether to estimate overlay values for all features, visible features, or a selection set from the Overlay drop-down list.
- To use buffers around features, enter a value in the Buffer size box and choose the units from the drop-down list.
- Choose the reference layer from the Layer drop-down list and choose whether to use all features, visible features, or a selection set from the Include drop-down list.
- To count the number of features in the reference layer, check the Count the Number of Features box.
- Optionally, check the Create a Report box to create a report, enter a title for the report, and choose a field to identify the features in the report.
- Click OK.
 |
NOTE: To learn about using the Attributes button, see To Change the Aggregation Method when Calculating Demographics. |
Maptitude creates the overlay, computes the attributes of features in the working layer, writes the results to a new table, and links it to the working layer in a joined view. If you chose to create a report, Maptitude generates the report and displays it in a new window. Reports can be printed, saved, exported, and emailed. Close the report window when you are done.
Try It Yourself: Using Overlays
1. Choose File>New Workspace or click  on the Standard toolbar, choose New map of {country name}, then use Create-a-Map Wizard to create a map of your address. You are going to estimate the population within one mile of a landmark feature of your choosing.
2. Right-click on the Landmark layer and choose Make Working Layer.
3. Click  in the Selection Tools drop-down on the Standard toolbar to activate the Select by Pointing tool.
4. Click on a landmark (e.g., a school  , grocery store
  , library
  , etc.) to select it. You may need to pan the map or zoom out a little if there are no landmarks visible on the map.
5. Choose Tools>Analysis>Overlay or click Overlay in the analysis tools drop-down on the Standard toolbar to display the Overlay dialog box.
6. Choose Selection from the Overlay drop-down list, type “1” in the Buffer Size edit box, and choose Miles as the units.
7. Remove the check from the Create a Report box.
8. Click OK. Maptitude displays a dataview with the overlay results for the landmark that you selected. Scroll to the right to see the demographic attributes within one mile of the landmark. The demographics will vary depending upon the country package that you are using but may include information on population, income, age, and housing.
9. Choose File>Close Workspace and click Don't Save to close the workspace without saving any changes.
©2026 Caliper Corporation