Maptitude Help / Tutorial / Displaying Data for Customers of Interest
Stage 6: Displaying Data for Customers of Interest
Now let’s look at the data associated with our customers.
 To Display Data for all of the Customers
- Right-click on the customer layer in the Display Manager and choose New Dataview to open a dataview with data about the customers.
- Choose Sales Over $250,000 from the drop-down list on the Standard toolbar to show only the selected customers.
Maptitude provides all kinds of commands to change the way information is displayed in a dataview. Let’s use a few of these commands to customize the information about the customers.
To Sort Customers by Sales
- Click in the column named [QTR2 Sales]. You may need to use the scroll bars or the arrow keys to locate this column.
- Click
 on the Standard toolbar or right-click on the column and choose Sort Decreasing.
Maptitude sorts the customers in decreasing order by 2nd quarter sales.
To Hide Columns in the Dataview
- Click anywhere in the column named Longitude.
- Click
 on the Standard toolbar, or right-click on the column and choose Hide.
 - Hide all but the Customer Name, Street Address, City, QTR1 Sales, QTR2 Sales, and Territory columns the same way. You can select more than one column by holding down the Ctrl key while selecting the column headings and then click to hide them all at once.
Maptitude lets you hide and rearrange columns any way you like. For more information, see Arranging Columns in a Dataview.
Now let’s create a formula field that calculates the change in sales from the first quarter to the second quarter.
To Create a Formula Field with the Percent Change in Sales
- Choose Dataview>Formula Fields or click
 on the Standard toolbar to display the Formula dialog box.
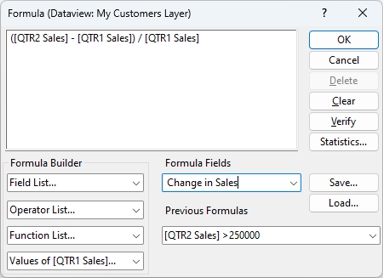
 - Type ( in the formula text box, choose [QTR2 Sales] from the Field List drop-down list, choose - from the Operator List drop-down list, choose [QTR1 Sales] from the Field List drop-down list, type ) in the formula text box, choose / from the Operator List drop-down list, and choose [QTR1 Sales] one more time from the Field List drop-down list. Your formula should look like this:
([QTR2 Sales] - [QTR1 Sales]) / [QTR1 Sales]
- Type “Change in Sales” in the Formula Fields editable drop-down list.
- Click OK.
Maptitude creates the formula field at the end of the dataview. For more information on formula fields, see Doing Calculations with Data.
Finally, let’s change the formats used for the three sales fields.
To Change the Display Format
- Choose Dataview>Fields>Properties or click
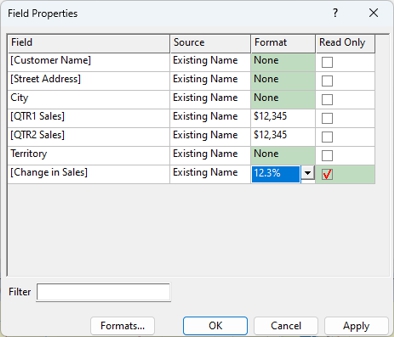
 on the Standard toolbar to display the Column Settings dialog box, which lists all column headings and display formats.
 - In the Format column of the grid view, choose $12,345 from the drop-down list for both the [QTR1 Sales] and [QTR2 Sales] fields and choose 12.3% for the [Change in Sales] field.
- Click OK.
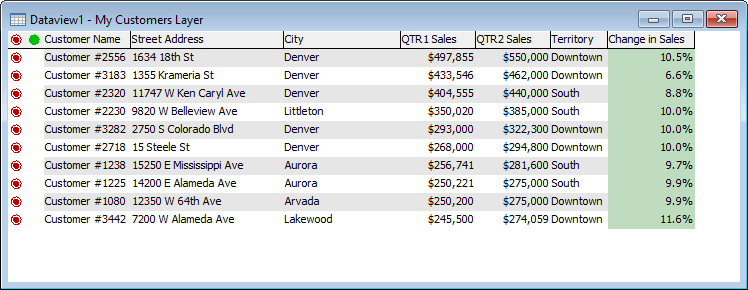
Your dataview showing the biggest customers should look something like this:
You can also export the data in a dataview to Excel and several other formats. Let’s export the information on the biggest nearby customers to an Excel spreadsheet.
To Export a Dataview to Excel
- Choose File>Export>Table to display the Save As dialog box.
- Choose Excel Worksheet (*.xlsx) from the Save as Type drop-down list.
- Type “My Top Nearby Customers” as the file name and click Save.
Now that we are done with the dataview, you can close it by clicking the Close button in the top right corner of the window.
Now let's use the other map of customer locations to do Step 7: Creating and Modifying Sales Territories.
©2026 Caliper Corporation