Maptitude Help / Tutorial / Using Your Data in a Map
Stage 1: Using Your Data in a Map
The Create-a-Map Wizard™ mapping tool guides you through many common Maptitude tasks. Whether you need to create a general map of a neighborhood, a city, a country, or the whole world, or create a thematic map illustrating your data, or perform geographic analysis based on your data, Create-a-Map Wizard can help you get started.
The Tutorial folder in your Maptitude documents folder contains an Excel spreadsheet with sample customer data for your region (e.g., Sample Customers United States.xlsx, Sample Customers Australia.xlsx, etc.). It includes the customer name, address, 1st quarter sales, 2nd quarter sales, and sales territory.
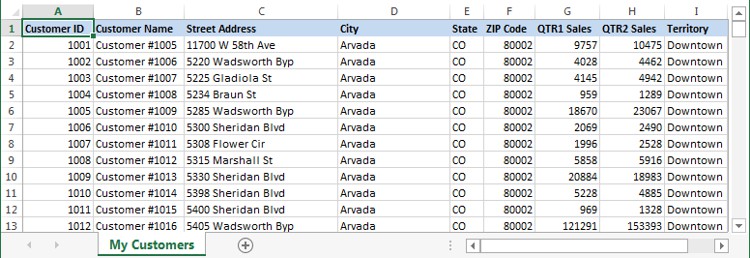
You are going to use information contained in this file to complete this project.
 To Create the Sales Map
- If you haven’t already done so, start Maptitude by clicking the Start button and choosing Maptitude from the Programs menu. Maptitude displays the Home dialog box. If you don’t see the Home dialog box, choose File>New Workspace or click
 on the Standard toolbar.
 - Choose New map of my data/table/spreadsheet in the New Workspace scroll list.
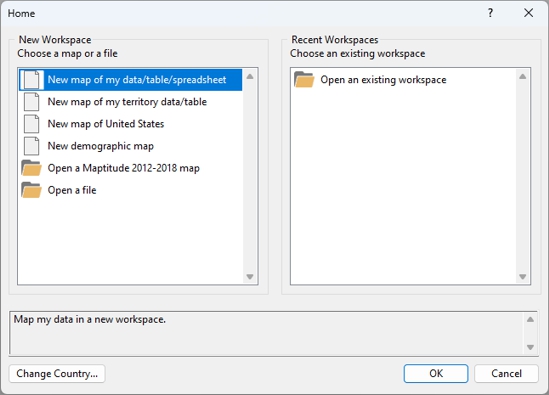
- Click OK.
Maptitude displays the Choose the File that Contains Your Data dialog box.
- Make sure that Excel Worksheet is the file type, browse for the Tutorial folder in the Maptitude Documents folder (e.g., Documents\Caliper\Maptitude 2026\Tutorial), choose the sample customer Excel file, and click Open.
- Click OK to use the “My Customers” sheet in the Excel file. Create-a-Map Wizard lists the mappable fields that it found in the Excel file.
- Click Next. Create-a-Map Wizard lists the types of maps that you can make based upon the data it finds in your spreadsheet.
- Choose Show ZIP Code boundaries with your data attached from the scroll list. (The exact wording will vary depending upon the country data you are using. e.g., Show Postal Area boundaries with your data attached or Show FSA Code boundaries with your data attached.)
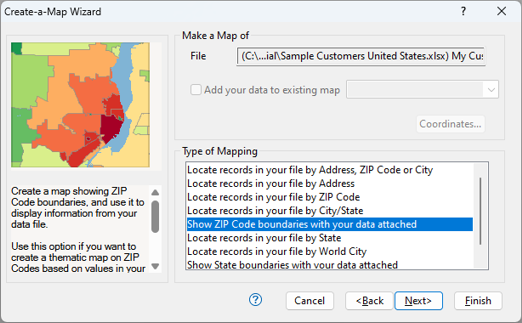
- Click Next. Create-a-Map Wizard asks you whether you want to import the Excel data into Maptitude or link the Excel file to your Maptitude map.
- Choose Import data to map it.
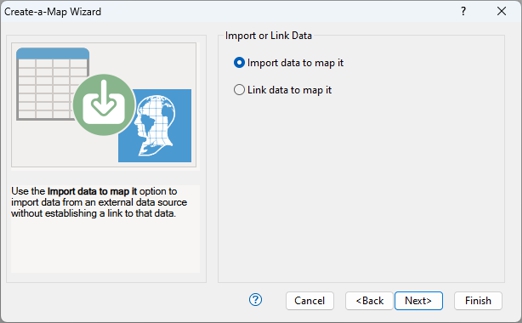
- Click Next. Create-a-Map Wizard shows the types of themes you can create with your data.
- Choose Color Theme from the radio list and [QTR2 Sales] from the scroll list.
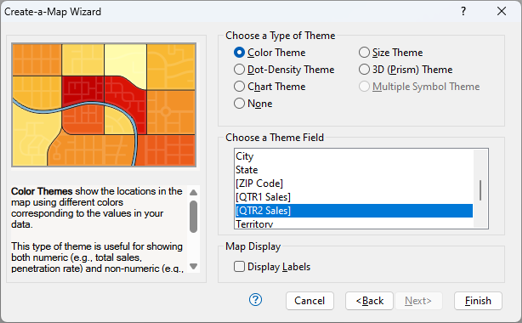
- Click Finish.
That’s all there is to it. Maptitude totals the 2nd Quarter sales in each postal code and displays the map with a color theme illustrating the sales data. Postal codes shown with darker colors have higher sales and postal codes shown in lighter colors have lower sales. If you are using the United States Country Package, your map should look something like this:
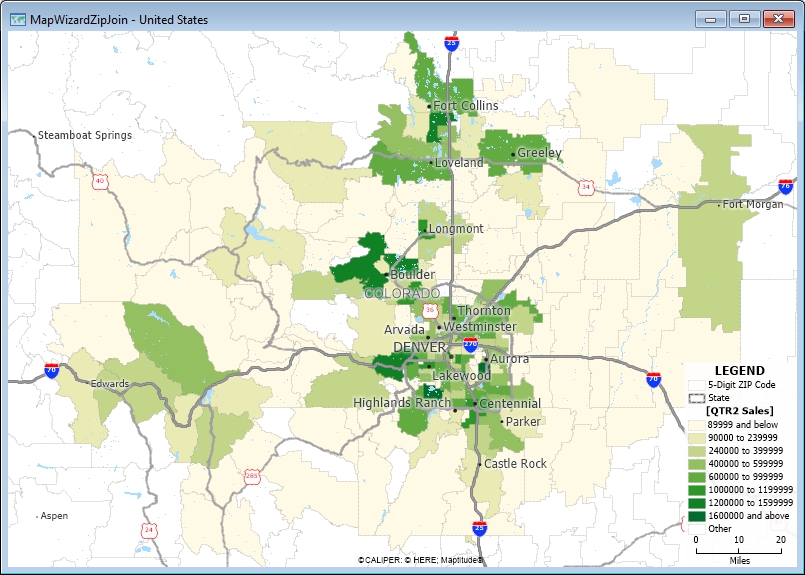
When you use the Create-a-Map Wizard tool, Maptitude automatically selects data, styles, labels, and a map scale appropriate for the type of area you wish to display. In addition, Maptitude calculates the sums and averages of all of the numeric data in your Excel file, and counts the number of customers in each postal code.
Let’s change the map to show the number of customers (stored in a field called [N My Customers]) in each postal code and customize the theme that is used.
To Change the Map Theme
- Choose Map>Thematic Mapping>Color or click
 Color Theme in the thematic mapping drop-down on the Standard toolbar.
 - Choose [Count My Customers] from the Field drop-down list.
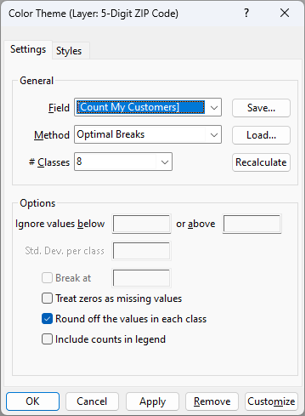
- Click the Styles tab and click Next>> to see different color schemes for the theme. When you find one you like, click OK.
Your map should look something like this:
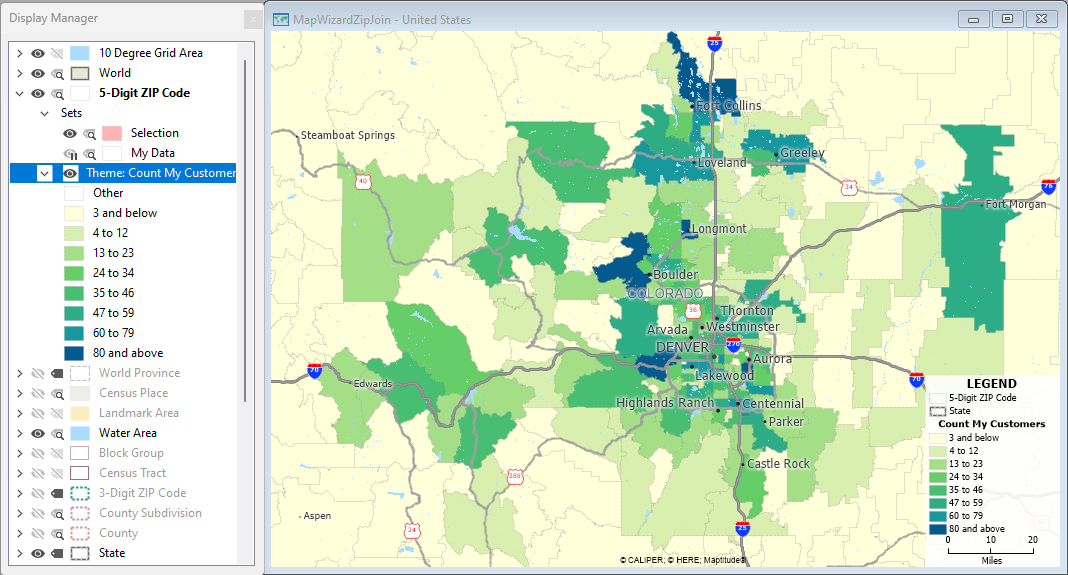
The map shows the postal codes, places, and some other features in your study area. Maptitude organizes map features into layers. Each layer is a group of features of the same type. ZIP Codes, populated places, highways, counties, and states are some of the separate layers that comprise this map in the U.S. region, and other regions have similar layers. A map can contain any number of layers.
Notice, however, that not all of the layers are visible in the map. Layers can be hidden or they can be set to draw only when the map is at a particular scale. When you “zoom in” or “zoom out,” you change the scale of the map. Most Maptitude maps are automatically set up to show different layers and labels as you change the scale of the map. This feature, called autoscale, makes maps more readable by reducing the clutter that can result from showing too much information at once. Maptitude also allows you to autoscale labels.
Also notice the Display Manager that is displayed with the map. The Display Manager allows you to view and control the style, visibility, and label settings for the layers in a map. With the Display Manager you can see the style of every layer in your map, whether or not labels are active for the layer, and whether or not the layer is currently visible. Layers that are visible have a  symbol next to them, layers that are hidden have a
  symbol, and layers that are active but not visible because the scale is outside of their autoscale settings have a
  symbol.
Let’s see how layers and autoscale work.
To Change the Visible Layers in the Map
- In the Display Manager, click the symbol next to a layer that is currently hidden. Use the County layer if you are using the U.S. region or some other hidden area layer if you are using another region. Maptitude draws the map with the layer visible.
- Click the symbol next to the Railroad layer. The symbol changes to a because the Railroad layer is autoscaled to only display if the map is zoomed in farther. Click the symbol to turn off the autoscale settings and display the layer.
Maptitude redraws the map with the Railroad layer visible.
- In the Display Manager, right-click on the Railroad layer you changed in step 2 and choose Restore Show/Hide to turn the autoscale settings back on for the layer.
If you want to learn more about changing the layers in a map, see Changing the Contents of a Map and Using the Display Manager.
To Move About the Map
- Choose Edit>Find or click
 on the Standard toolbar.
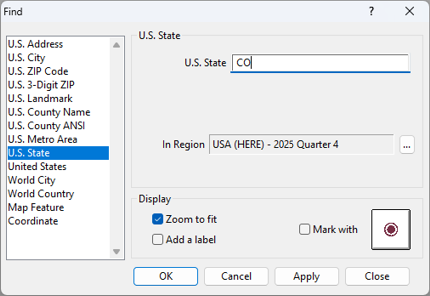
 - Choose a type of feature to find from the scroll list, type the name of the feature in the edit box, and click OK. For example:
- If you are using the U.S. region, choose U.S. State from the scroll list, type “CO” in the edit box, and click OK to display all of Colorado in the map window.
- If you are using the Australia region, choose Australia State from the scroll list, type “Victoria” in the edit box, and click OK to display all of Victoria in the map window.
- If you are using the Canada region, choose Canada Province from the scroll list, type “Ontario” in the edit box, and click OK to display all of Ontario in the map window.
- Again, choose Edit>Find or click on the Standard toolbar.
- If you are using the U.S. region, choose U.S. County Name from the scroll list, type “Denver CO” in the edit box, and click OK. Otherwise, choose to find another map feature such as Australia Suburb and type “Newtown VIC”, or Canada City/Town and type “Sudbury ON”, or Mexico City or Town and type “Tijuana BJ”, etc.
Maptitude zooms the map to the feature you chose. Notice that the status bar shows the scale in both miles (or kilometers) per inch (or centimeter) and as a ratio.
- Click
 on the Standard toolbar to activate the Zoom In tool.
 - Click on the map. Maptitude zooms in by a factor of two. Notice that the status bar shows the current scale is half of what it was before.
- Now, click and drag a rectangle on the map. Maptitude expands the contents of the rectangle so that it fills the map window.
Notice that as you zoom in different layers and labels are added to the map.
- Next, click
 on the Standard toolbar to activate the Zoom Out tool.
 - Click on the center of the map. Maptitude zooms out by a factor of two.
- Finally, click
 on the Standard toolbar to activate the Pan tool.
 - Click and drag on the map to pan to a new location.
If you want to learn more about how to change the scale of a map, see Moving Around a Map.
To Return a Map to Its Original Scale
- Choose Map>Zoom>Undo All or click
 Undo All Zoom in the undo zoom drop-down on the Standard toolbar.
Maptitude draws the map with the extent that was used when the map was created.
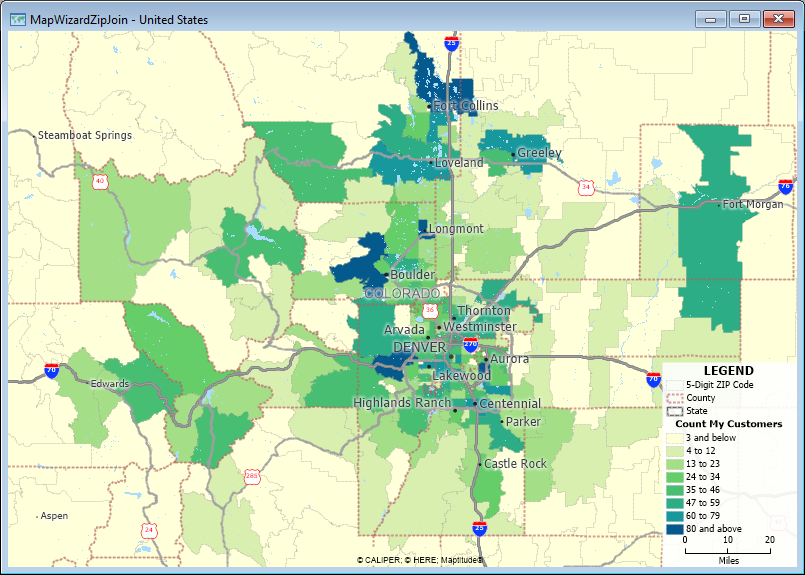
You’ve finished the thematic map showing the number of your customers in every postal code which should look like the map below.
As with all software, it is a good idea to save your work occasionally.
To Save the Workspace
- Choose File>Save Workspace or click
 on the Standard toolbar.
 - Type "My Maptitude Tutorial" as the file name and click Save.
Maptitude saves the open map to the workspace file.
Let’s move on to Stage 2: Locating Your Customers on a Map.
©2026 Caliper Corporation