|
August 2017 Newsletter |
|||
|
|||


Website | Contact Us | Pricing | Live Demo | Free Trial | Reviews
Want More Free Premium Data?
Healthcare Layers are Now Updated for Maptitude 2017!
 Point
layers with the locations of over 5
million medical and healthcare providers
across the USA have been updated and are now
downloadable for free for Maptitude 2017
users only. Don't have Maptitude
2017?
Purchase or upgrade to Maptitude 2017 to use this premium business data.
Point
layers with the locations of over 5
million medical and healthcare providers
across the USA have been updated and are now
downloadable for free for Maptitude 2017
users only. Don't have Maptitude
2017?
Purchase or upgrade to Maptitude 2017 to use this premium business data.
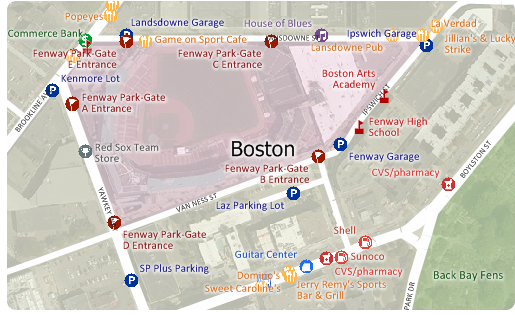
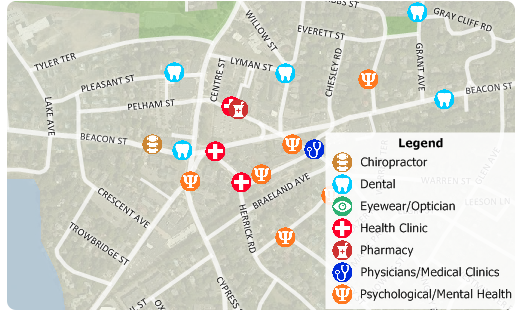
The download includes three point layers that can be added to any Maptitude 2017 map. The Healthcare Organization layer shows the locations of facilities, while the Healthcare Provider layer shows the locations of individual providers. Both layers include the taxonomy codes and descriptions for each location, e.g., General Acute Care Hospital Children (282NC2000X), and Registered Nurse (163W00000X), respectively. Each record has up to 15 taxonomy codes for services provided. You can also filter using Medicare charges and payments.
Also included is a second healthcare organization layer that shows only the locations of hospitals. The Hospital layer includes the number of hospital beds, plus hospital address, phone number, and type of hospital (e.g., VA, military, children's, general).
Maptitude includes a vast data at no additional cost, such as demographics, hospitals, pharmacies, and population counts by health coverage type.
![]()
![]()
 |
"This is awesome mapping software. We use it to create heat maps of where our patients live. This allows us to intelligently decide where to add services in our area." Philip Moya San Antonio Kidney Disease Center |
Featured Map:
Plastic Surgeons Density
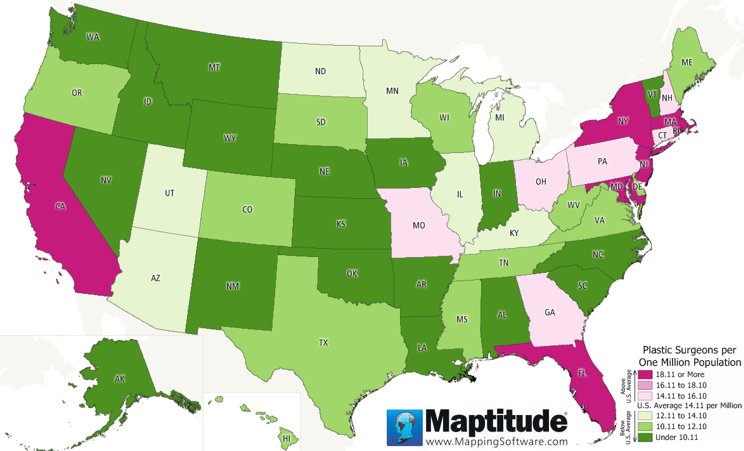
This Maptitude 2017 map shows the number of plastic surgeons per 1 million people. Those states in shades of pink have above average access to a plastic surgeon while those states in shades of green have below average density. Washington DC has the highest ratio, while Wyoming has the worst access to a plastic surgeon. Of surprise to some, California comes in at 7th place.
Tech Tip:
How Do I Download the Free U.S. Healthcare Layers for Maptitude 2017?

The healthcare map layers for Maptitude 2017 are accessible as a free download. In this tech tip we describe how to install the layers and add them to a map.
Tricks & Tips:
Performing a Lasso Analysis Using the Healthcare Layers
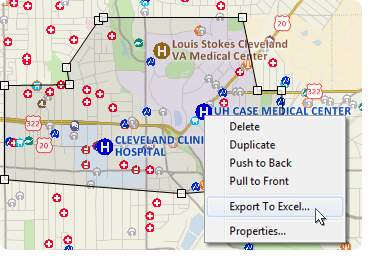
When you have added one or more healthcare layers to your map as described in the above Tech Tip, you can then perform a lasso analysis on those layers.
Using the Drawing Toolbar (Edit > Drawing > Toolbar) you can use the Freehand Shape tool to single click points around the lasso and double click to close the lasso. You can then right-click on the shape and choose Export to Excel. The resulting report will contain a demographics (overlay) sheet, and sheets for each healthcare layer showing the attributes of the locations.
If you do not want a certain layer to appear in the report then you can turn the layer off in the Display Manager (e.g., Hide the City/Town layer before exporting to Excel to exclude city/town information).
Learning Maptitude:
Webinars and Training Dates for Maptitude 2017
 |
Upcoming Training: |
|
 |
2017 Webinars (Free)! |
![]()
![]()
International Mapping:
| www.caliper.com |
Copyright ©2017, Caliper Corporation. All Rights Reserved. |