10 October 2025
Maptitude real estate mapping software empowers property professionals and real estate agents with the fundamental mapping and geographic analysis tools that they need for residential or commercial real estate. With Maptitude, you can visualize locations and assess them for desirable qualities.

| Real estate mapping solutions highlights |
|---|
|
Using Maptitude, you can answer your clients' questions about the neighborhood of a residential property. By simply typing an address, you are taken to the correct location on a map where you can provide answers to question such as: Is the site near major roads? Are there schools nearby? Is the income level suitable to first-time residential buyers? Are there parks or other amenities nearby? What is the range of home values? These are just a few of the questions that can be answered by simply looking at a map produced with Maptitude.
Maptitude comes with a wealth of demographic data to further enhance your real estate maps and your location-based knowledge. Quickly identify areas with many young children, more retirees, higher income, or more owner-occupied housing. You can also add your own data such as home sales, crime statistics, or school performance scores to convey additional data that may be of particular value to your residential clients.
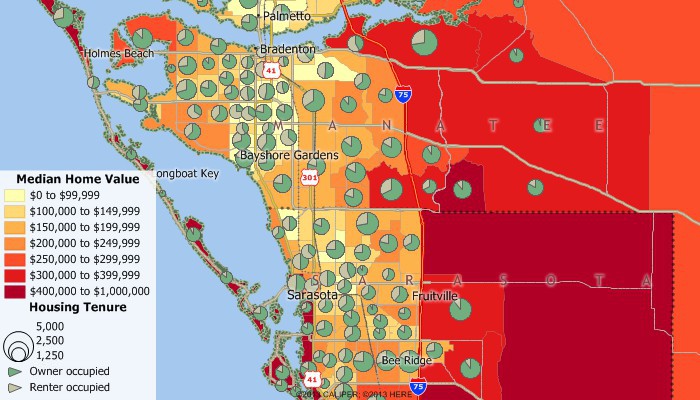
Use the included data to create maps such as this one of home values and housing tenure.
You can add your listings to a map so that clients can visually determine the locations available for sale in any given neighborhood and weigh the relative pros and cons of each location. You can use the filter tools to search your listings, based on location or attributes. For example, you could choose from among all of your listings the ones that are within walking distance to a school, near public transportation, within a particular price range, or have a minimum number of rooms.

|
“I have access to traffic counts, local businesses, demographic information, drive times, and aerial imagery, all at the tips of my fingers. The program is easy to use, as well.” Kellye Martin |
 |
“Maptitude is critical for providing information in commercial real estate location selection. Maptitude is a very versatile GIS system which is able to produce a wide variety of maps economically.” Louis Scudere |
Maptitude is a powerful tool for commercial real estate applications because it lets you quantify differences in sites. The demographic data included with Maptitude are ideal for evaluating sites, analyzing competitor's locations, identifying market potential, and comparing sites to one another both geographically and demographically.
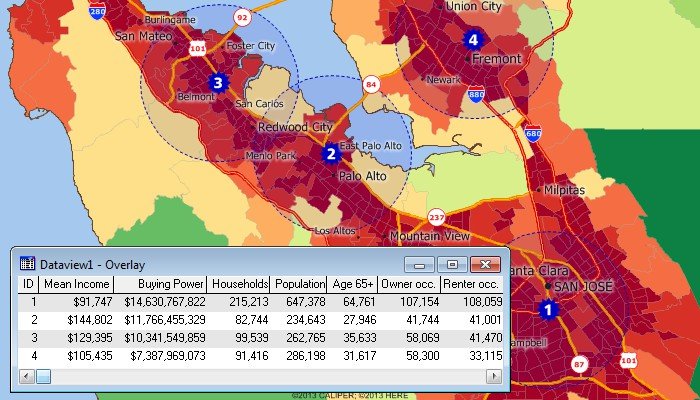
Site analysis can be performed with the included Census data. This map and table show the demographics of the population within five miles of several locations.
Also included are building footprints for many urban locations and comprehensive named landmarks that range from public facilities to commercial buildings including shops, restaurants, and retail stores allowing you to get a full understanding of a location's amenities.
Additionally, map backgrounds can be seamlessly switched to show aerial photo-imagery or terrain, adding realistic and relatable elements to your presentations.
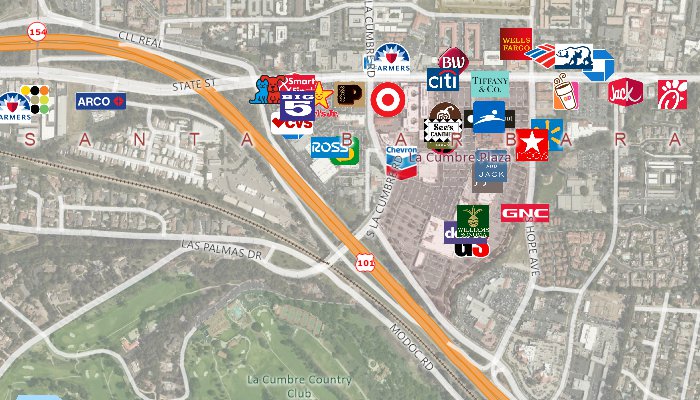
Detailed data, including streets and landmarks, are included. Additional tools allow you to access aerial and satellite imagery from the internet.
If you are considering relocating a business, you can evaluate sites based on their accessibility to your customers or employees. For example, if you have a database of employees, you can use Maptitude to see the best central location based on the density and distribution of the employees. These could be weighted by seniority, allowing you to better explore potential site locations by considering staff characteristics.
You can also create drive-time or distance rings to assess the accessibility of a location. Pin the locations of your customers to a map and compare the number of customers able to access each site various time intervals.
Use the Facility Location Wizard to identify good locations for warehouses, hospitals, retail stores, manufacturing facilities, and other types of facilities. Choose a specific number of facilities to open or have Maptitude determine the number that is required to meet a specific objective.
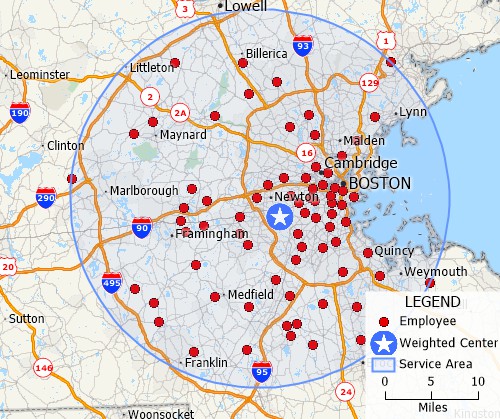
Site location tools let you identify efficient locations for serving all of your customers or employees.
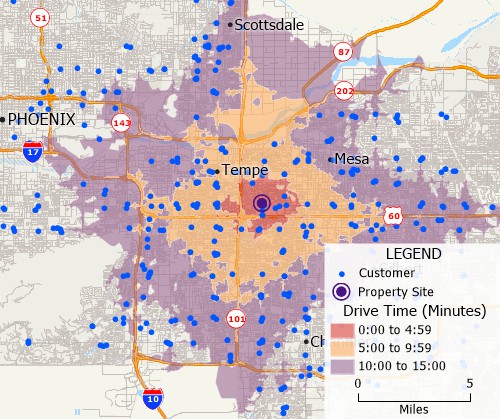
Drive-time ring tools let you visualize the accessibility of locations.
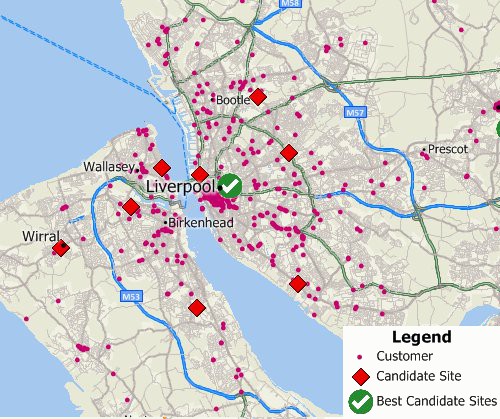
The Facility Location Wizard identifies preferable locations from a set of candidate locations

|
“I have access to traffic counts, local businesses, demographic information, drive times, and aerial imagery, all at the tips of my fingers. The program is easy to use, as well.” Matt Myers |
 |
“Maptitude is a great program. As a real estate appraiser who primarily values commercial properties, I have found the functions and data provided a great benefit in showing clients what is going on in a specific area. Features such as exporting data to MS Excel which can be put in my reports.” Bruce Ownby |
Maptitude mapping and analysis tools are also relevant in all aspects of the real estate industry:
In all cases, Maptitude is the cost-effective solution that utilizes geography and maps as powerful tools for conveying information and analyzing location, location, location for your business advantage.
 Check out our G2 Reviews
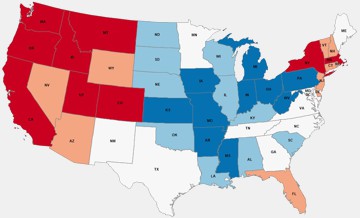


Home | Products | Contact | Secure Store
