One of the best reasons to use Maptitude is to unearth and analyze the geographic components of your data. Maptitude includes many tools that allow you to understand trends, evaluate sites, and define optimal routes. You can integrate Census statistics with your own data to identify geographic characteristics that impact you and your operations. You will be amazed at how quickly you can enhance your decision making using this easy-to-use mapping tool.
Create territories based on a table or Excel spreadsheet of data, interactively by clicking on features in a map such as postal areas, or manually by drawing whatever boundary lines you require using the Maptitude editing tools. It is also possible to create overlapping territories or territories based on streets. Your territories can be stored natively in Maptitude or in formats including Shapefile, Oracle Spatial, or SQL Server Spatial.
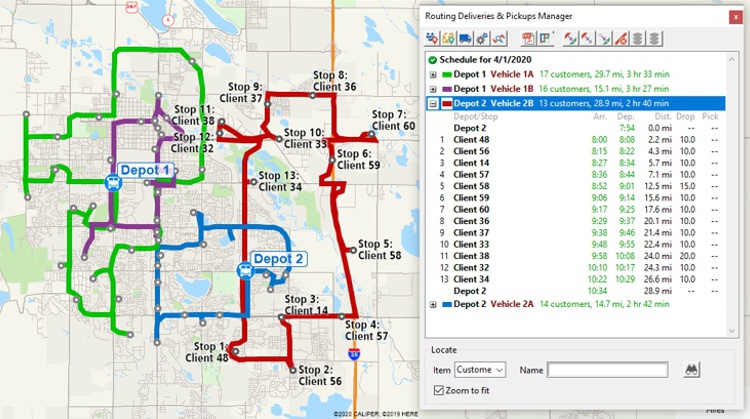
Optimize routes for several vehicles needing to reach many destinations in fixed time windows from one or more depots.
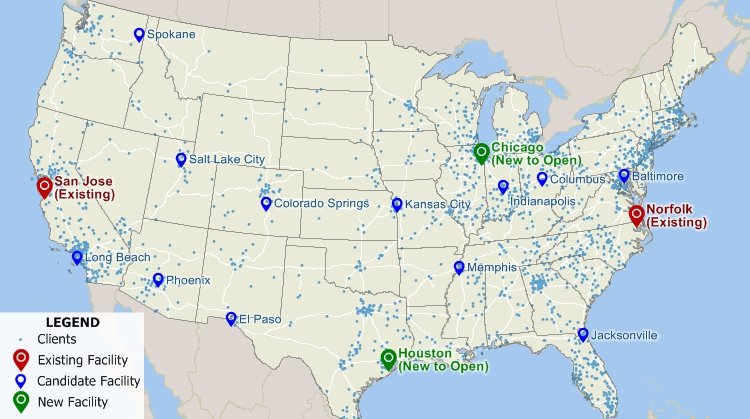
Automatically identify the best location for one or more facilities from a set of candidate sites.
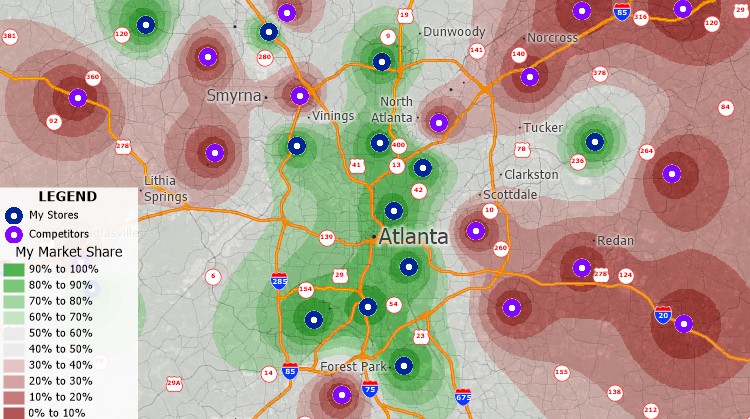
Use the Market Share Wizard to calculate your market share for an area by examining how attractive your stores are compared to all competing stores.
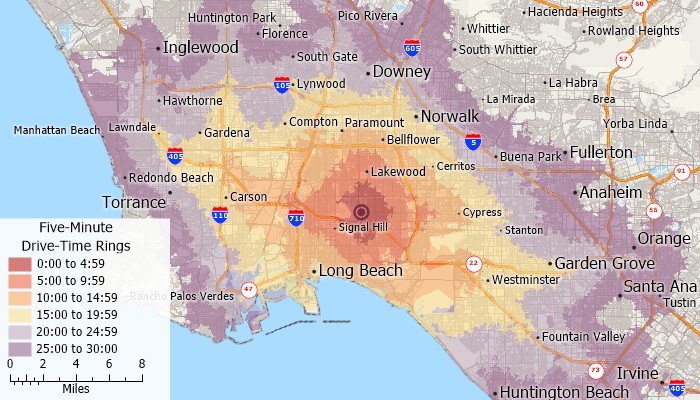
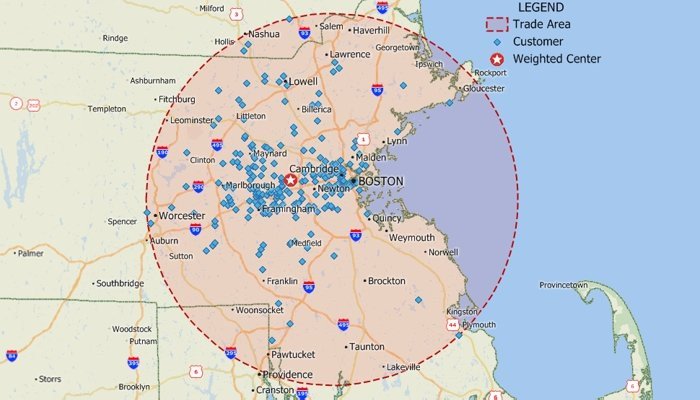
Create rings that are based on distance, time, or other travel costs along streets or other lines. For example, you could create rings based on driving distance to your stores to identify areas that are not well served.
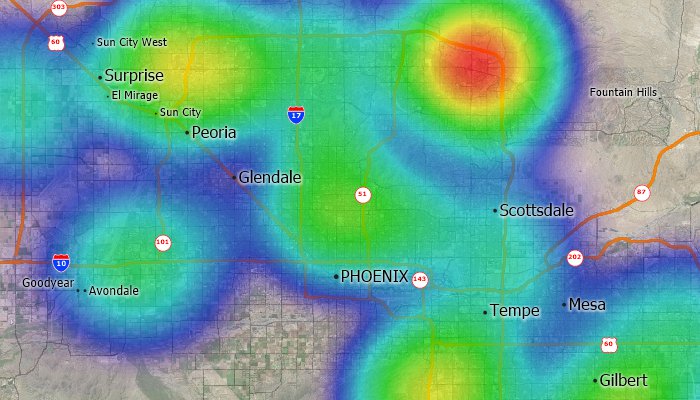
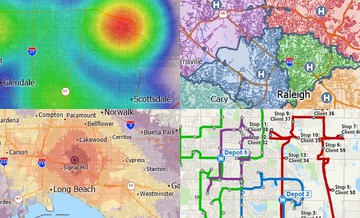
Visualize point data by transforming the points into a regular grid. This makes it easy to identify customer concentrations, crime hot spots, or disease outbreaks. In addition, the grid can be weighted based on a value you choose. For example, find concentrations of commercial properties that are weighted by the number of square feet.
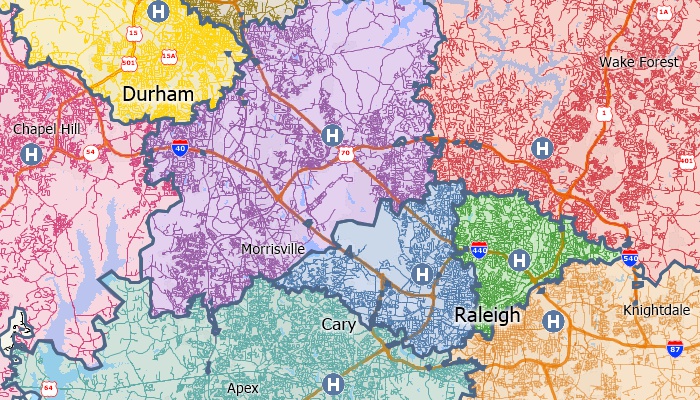
Partition streets into zones so that each link is assigned to a feature based on the time or distance to that feature. For example, you can divide the streets in a city so that each is assigned to the nearest hospital or fire station.
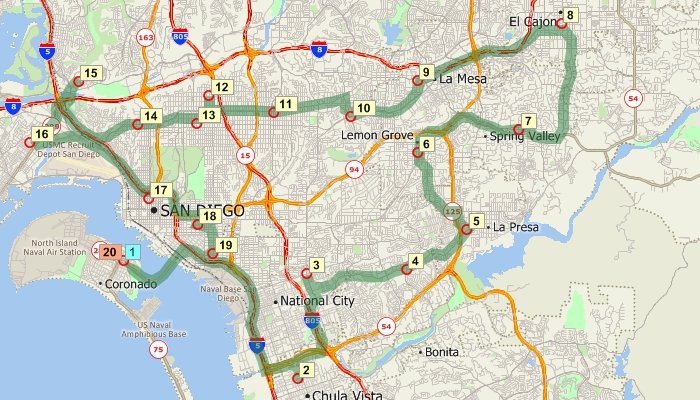
Identify routes between points and choose whether to minimize distance or time. When a trip involves several stops, Maptitude can even help you decide the best order in which to visit them. The street layer included with Maptitude includes one-way streets and travel times allowing you to create the most accurate routes ever in Maptitude.
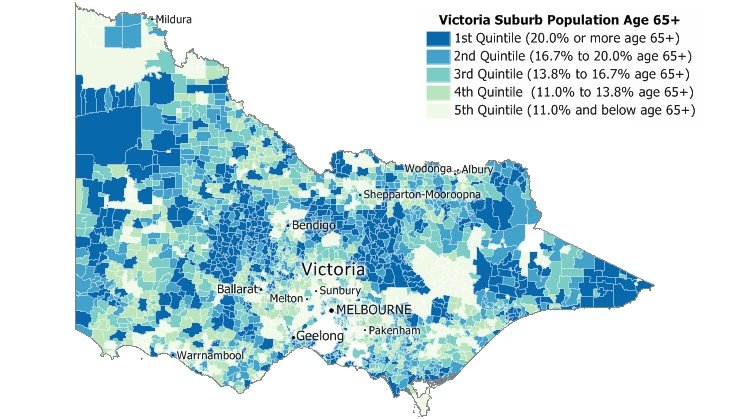
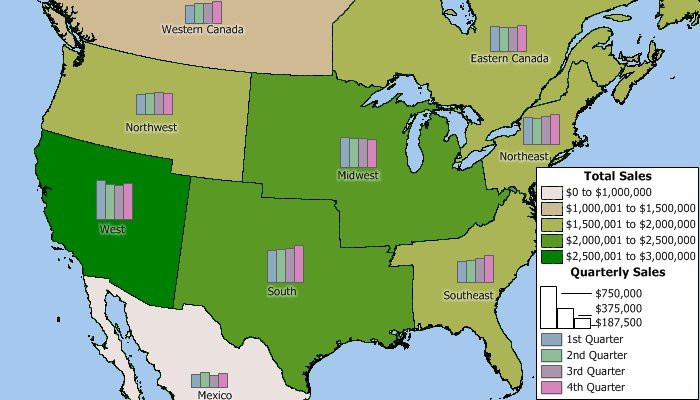
Classify by quantiles, equal weight, equal interval, standard deviation, nested means, arithmetic or geometric progression, Fisher-Jenks/optimal breaks, categories, and manual classification.
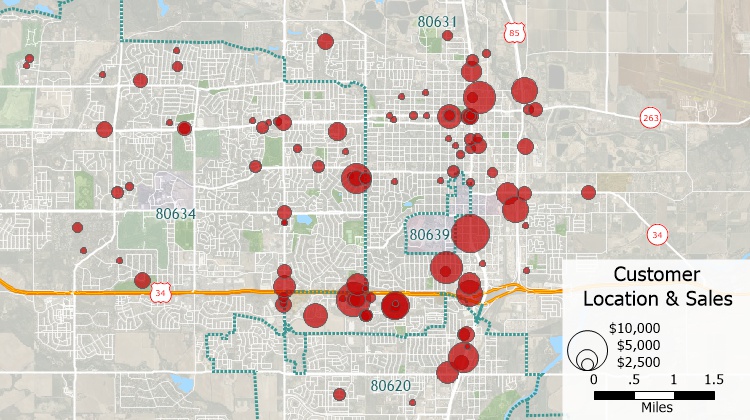
Pin map features by address, intersection, ZIP/Postal Code, town, coordinate, or by clicking on the map to see the distribution of your customers, facilities, or other resources.
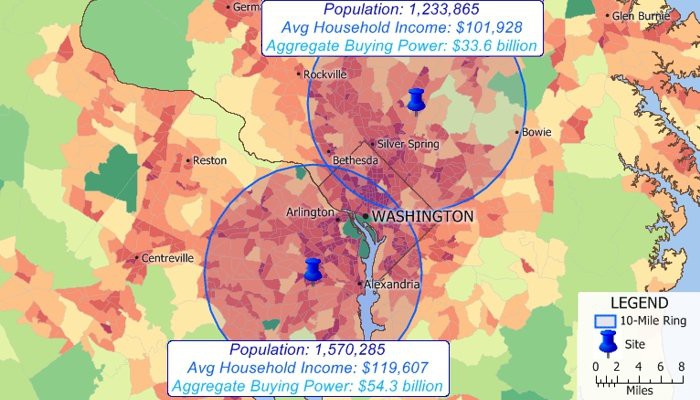
Automatically create rings around any number of map features and then analyze the characteristics of those areas. Find out how many customers live within a certain distance of a store, compute the demographic characteristics around potential store sites, analyze the neighborhoods most affected by noise pollution from a highway, or determine accessibility to facilities.
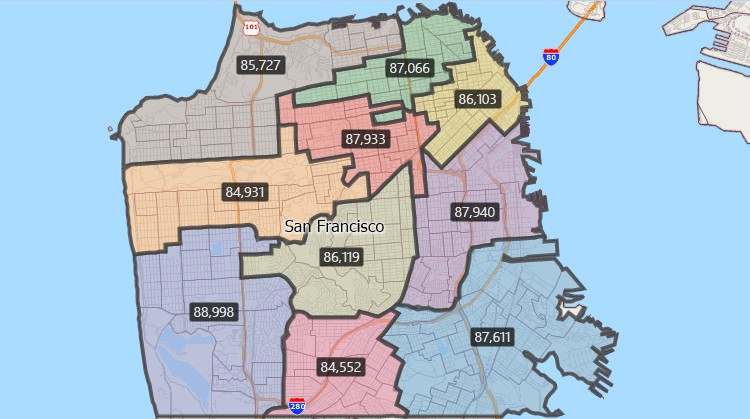
Automatically create territories that are balanced by a specific demographic variable.
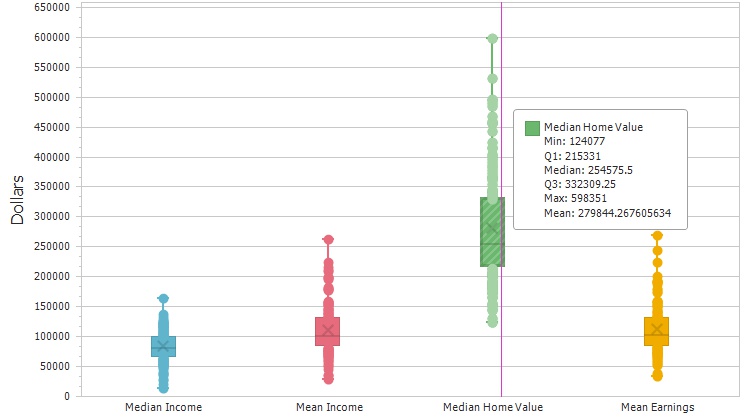
Compute summary statistics (sum, min, max, mean, standard deviation), compute spatial autocorrelation, and create box plots, histograms, and radar charts.
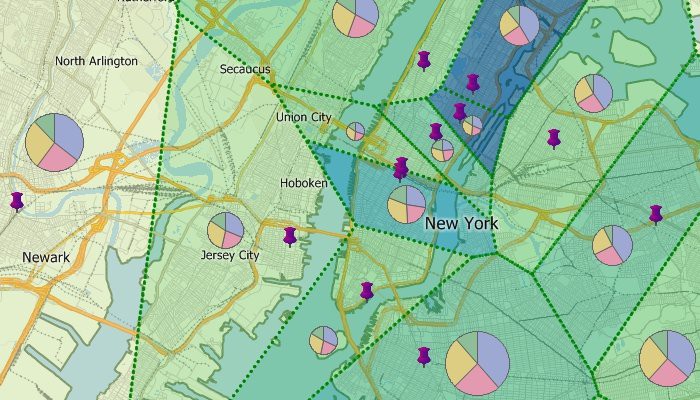
Determine the areas closest to each of your facilities by building areas of influence, then estimate the attributes within each area to determine areas that are under- or over-served.
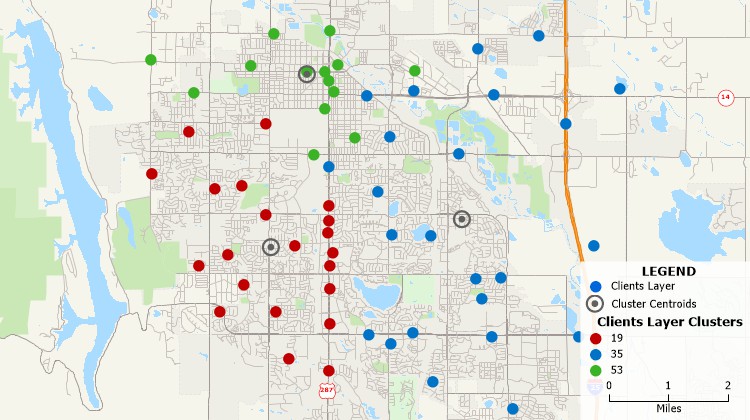
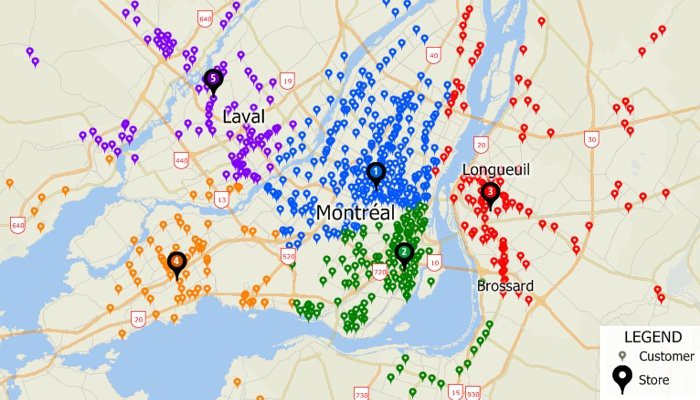
Automatically group points or areas into compact clusters, while placing optional constraints on the clusters such as maximum size or a balanced total field, such as sales or population.
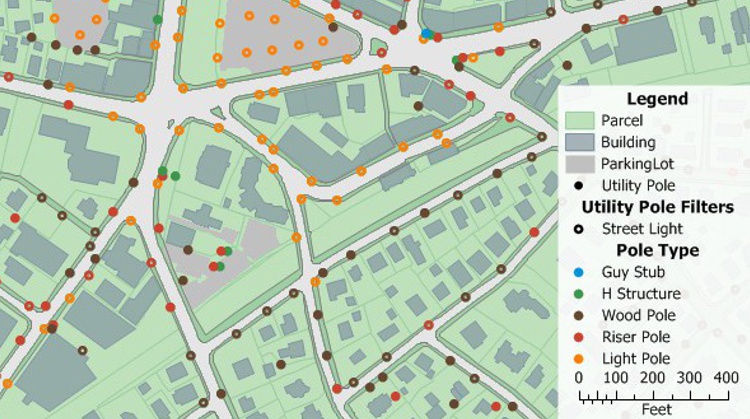
Filter features based on geographic location, proximity to other features, by radius, by pointing, by polygon, or based on a value or condition.
Site location tools let you identify efficient locations for serving all of your customers or employees.
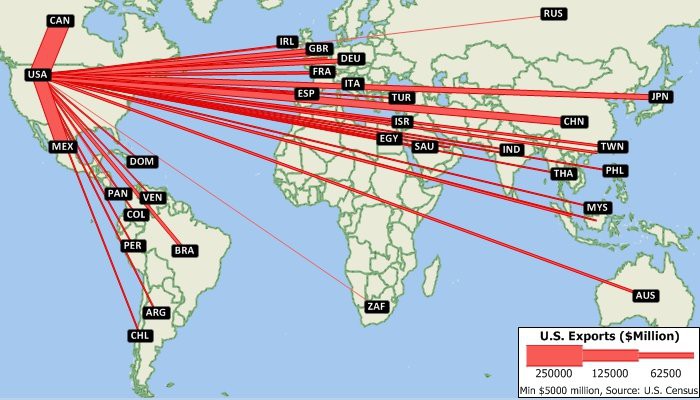
Illustrate the flow of people or goods from point to point based on values in a dataview.
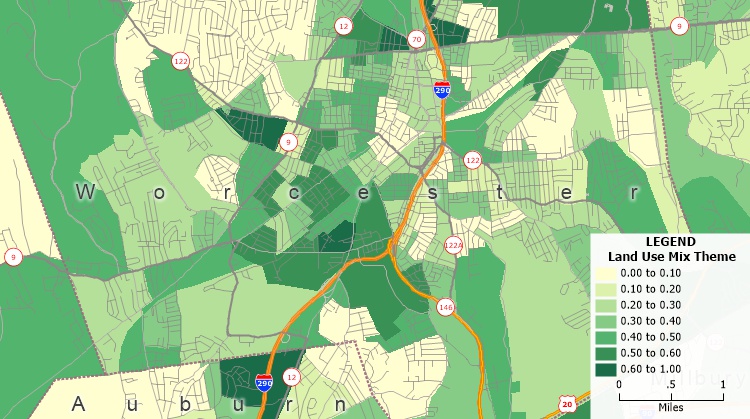
Quantify access to different land use types to measure the evenness of distribution of land-uses present in a region.
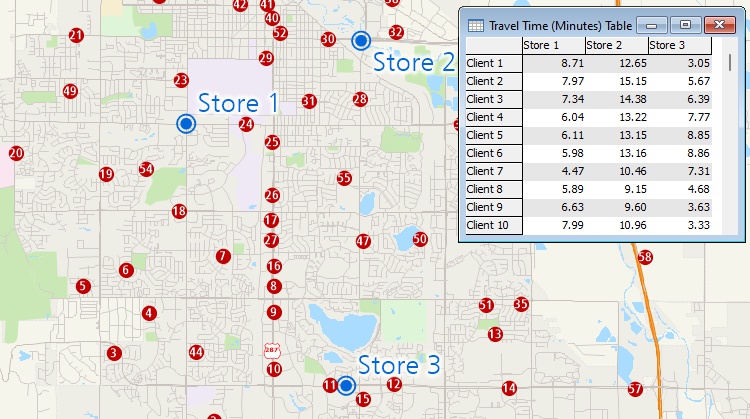
Measure areas and distances, find closest features, and compute drive-time or distance tables.
Create vector line or point layers from GPS playback files.

Use the included demographics to estimate the populations around features, within territories, or within a drive-time radius.
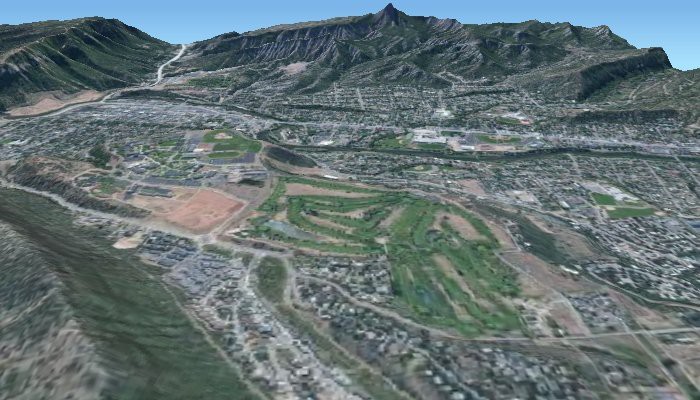
Analyze and display surfaces on a two-dimensional map or as a 3D map. You can create contour maps of elevations and then determine the viewshed for any location, either at ground level or at a particular height. You can also create surfaces that represent data values, such as measures of air pollution or radon, over a geographic region.