
Before beginning the redistricting process, it is useful to understand the data available to you and have a grasp of some basic terminology. Importantly, not everyone will have access to the same information. Many states explicitly require the use of Census data for legislative and/or congressional redistricting, but some do not identify specific data sources, and others specifically allow for the use of other data sources for redistricting, depending on the circumstances.1 For most localities, the 2020 headcount of the population will be highly relevant for redistricting. Also, it should be noted that it is the decennial Census that provides the geographic boundaries of census blocks, and that geography is relevant even if other attribute data are used for creating districts.
Census Geography
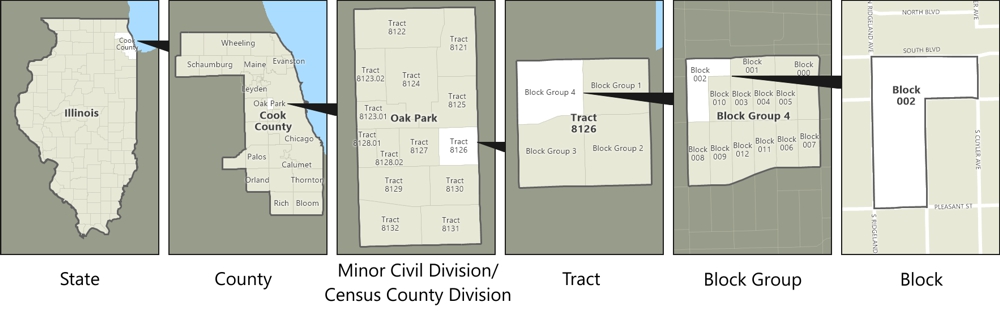
Census blocks are the smallest geographic unit used for decennial census tabulations. In urban areas, they are similar to a street block. Census blocks are generally bounded by physical features such as roads, rivers, or power lines but can sometimes be bounded by nonphysical features such as precinct (voting districts), city, or county boundaries. Each census block has a unique identification number that is assigned by the Census Bureau.
Census block groups are statistical divisions of Census Tracts comprised of census blocks and generally contain between 600 and 3,000 people.
Census Tracts are small, somewhat permanent geographic entities within counties (or the statistical equivalents of counties) delineated by a committee of local data users. Generally, Census Tracts have between 2,500 and 8,000 residents and boundaries that follow visible features. When first established, Census Tracts were to be as homogeneous as possible with respect to population characteristics, economic status, and living conditions but that also is neither ensured nor even likely to be feasible. Census tracts were first defined in 1970, and the Census Bureau attempts to maintain them as consistently as possible across the decades.
Understanding the Relationships Among U.S. Census Geography
The 2020 Census and The Public Law 94-171 2020 Redistricting Data
The 2020 Census attempted to count every person living in the United States and the five U.S. territories. The 2020 Census enumeration reports counts of population by race, ethnicity, age, sex, and housing type. The Block level data are based upon a direct headcount obtained through a variety of means that attempts to be as complete as possible. Since there are difficulties in obtaining Census responses from all residents, some data are estimated for hard-to-reach populations. Generally, the headcount is an underestimate of the correct resident population due to difficulties in data collection and the reluctance of certain populations to provide the requested information.
Public Law (P.L.) 94-171, enacted by Congress in December 1975, requires the Census Bureau to provide states the opportunity to identify the small area geography for which they need data for the purpose of legislative redistricting. It also imposes time limits on the delivery of the data to each state’s governor and legislative leadership.
Requests for data for small area geography could include election wards and precincts and state house and senate districts. The data were to be provided within one year of the completion of the Census. Due to COVID, there has been a substantial delay and the data have been released in August 2021. When available, ward and precinct level data may be useful in redistricting.
The specific data items and breakdowns provided are as follows: Both the number of households and the number of people is reported in total and by age, numerous racial categories, and Hispanic ethnicity.
Race variables include the White alone population, Black or African American alone, American Indian, and Alaska Native alone, Asian alone, Native Hawaiian and Other Pacific Islander alone, and Some Other Race alone, as well as individual variables for the population of these same groups for two races combined through six races combined. The Hispanic or Latino and Not Hispanic or Latino by Race variables include totals for Hispanic or Latino populations and then separate them into populations of one of the aforementioned races alone or combined through six races combined. Race for the 18+ population includes population of one race and multiple races, again allowing for the possibility of a combination of up to six races. Hispanic or Latino and Not Hispanic or Latino for the 18+ population is broken down in the same fashion. Group Quarters population is divided into the institutional population and noninstitutional populations. The institutional population is subdivided into correctional facilities for adults, juvenile facilities, nursing facilities, and other institutional facilities. Noninstitutional facilities population is broken into college/university student housing, military quarters, and other noninstitutional facilities.
Typically, only a few of these data items are used in drawing district boundaries. Specifically, total population, voting age population, and summary race and Hispanic ethnicity data are frequently utilized but as we will explain subsequently, many other variations are encountered.
Of additional relevance are measures taken by the Census Bureau to modify the collected numbers from the 2020 Census with a complex mathematical algorithm that is used to implement “differential privacy.” Differential privacy is intended to enable the public sharing of patterns in the data of groups while anonymizing the personal data of individuals. We do not believe that this form of privacy protection is either necessary or lawful or that the algorithm used is good enough, but you as a resident should simply understand that the population numbers reported for small geographic units may not be strictly correct. In fact, at the local level, counts of population by race and ethnicity at the block level are likely to be biased due to differential privacy. Differential privacy modifications to the headcount are being challenged in the courts, but it is not known if those challenges will be successful. Despite these issues, the published data will be used by most for redistricting as no better estimates are readily available.
American Community Survey Data
In many instances, other data are used in redistricting. Some of these data may be locally collected, but much of the data come from the American Community Survey (ACS) that is administered by the Census Bureau on a continuing, monthly basis to residents of the U.S. The ACS takes the place of what used to be the long form in the decennial Census and is used to provide additional demographic data to characterize the resident population for many public policy analysis purposes. Small area data are only available from the ACS for a rolling 5-year period and only at the block group level and above due to the small sample sizes employed. Also, the margins of error (which are published) are very high at the block group level.
The most recent ACS data is based on surveys conducted from 2015 to 2019. As a survey sample, the ACS data do not establish the total population of any geographic area. However, they do provide a rather detailed albeit not current portrait of residents’ demographics by place of residence. Among the data published in addition to those from the headcount are tabulations of citizen status, country of origin, language spoken, housing characteristics including renter and home ownership status, education levels, and income.
In redistricting applications, the ACS block group level data are often “disaggregated,” or allocated to the Block Level. This might be necessary in some situations, but the methods used are, at best, approximate and will lead to even greater margins of error at the block level making these data potentially highly unreliable.
The Census Bureau has indicated that the 2020 ACS are compromised by low response rates due to the COVID pandemic and that there will not be an official release of these data. Instead, the data will be released as an experimental dataset. It is not known what the consequences of this decision will be for those who rely upon ACS as the best available estimates of small area demographics.
Citizen Voting Age Population by Race and Ethnicity
One particular dataset, the Citizen Voting Age Population by Race and Ethnicity (CVAP), is commonly encountered in redistricting and deserves special mention.
CVAP was originally published in in 2002 based on the 2000 Census for use in voting rights analysis. It has been cited by courts in measuring minority voting strength. After the 2010 Census, the Census Bureau began using the most recent ACS 5-year estimates to publish annual CVAP data. In February 2021, the U.S. Census Bureau published the CVAP based on the 2015-2019 ACS. CVAP data shows population of those 18 and older by citizenship status and race/ethnicity down to the block group level. The data also shows housing status.2 According to the Census Bureau, there will be a new release of CVAP in March 2022 that will also be based on ACS.
Voting Rights Act Compliance Data Usage
Plans are frequently challenged in court, so should you be successful in having your suggestions adopted, you should be prepared to have all your data subpoenaed during discovery. It is good practice to keep your maps labeled using clear and reasonable naming conventions.
Other Data
A variety of other data may be encountered in redistricting applications. Voter registration data is available in many states and can be geocoded to the census block level providing information on the number of registered voters in each census block by party of registration. While these data are used by politicians for fund raising and other purposes, they may be precluded from use in some redistricting situations.
When available, voter registrations by political party can be used to evaluate competitiveness, a stated redistricting principle. Comparison of voter registration data with population data can be used to establish the percentage of potential voters in each census block. Data on actual voting participation and voting outcomes are typically available at the precinct (voting district) level. These data can also be disaggregated to the census block level.
Political parties also have large and potentially comprehensive data on residents and their personal characteristics. Data can be readily purchased on U.S. residents from commercial data vendors for pennies or less per record. One should not be surprised to find that some redistricting efforts privately use this type of information.
Another type of data relevant for redistricting but not always available or available in suitable form are demographic forecasts. Because districts are typically redrawn only once every ten years, the future composition of districts can be very important in choosing a good plan. While small area forecasts are not ubiquitously available, state demographers and local universities may have data on demographic trends that can be used in redistricting.
Here are some articles that might help you with other data questions:
- What Data Do I Get with Maptitude for Redistricting?
- How Do I Incorporate Block Level Data into Other Layers?
- How Do I Incorporate ACS Data into My Plans?
1 https://www.ncsl.org/research/redistricting/redistricting-and-use-of-census-data.aspx, Accessed on June 14, 2021.
2 https://ssds.stanford.edu/us-census-bureau-releases-voting-age-population-race-and-ethnicity-cvap-file,, Accessed on June 16, 2021.