|
February 2018 Newsletter |
|||
|
|||


Website | Contact Us | Pricing | Live Demo | Free Trial | Reviews
You will quickly find the cost savings & opportunities hidden in your data
Maptitude 2018 has new premium data, new features for MapPoint users, and enhanced data import and report creation tools.


Data
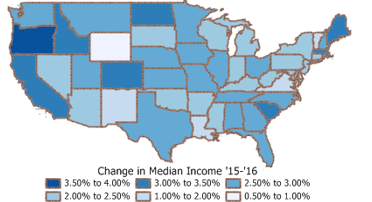
New U.S. data sets provide access to the most up-to-date geographic information available, including four new fields covering the growth in income and population, and daytime population counts. More...
Enhanced Data Import
Data linking was one of the best features of Microsoft MapPoint and has been added to Maptitude 2018! Maptitude 2018 allows you to update your map with any changes made to your data source. For example, if you have added/deleted/changed customer records in an Excel spreadsheet, you can simply choose to update your Maptitude map layer with the latest information and locations. More...
Sharing
Maptitude dominates the space vacated by the discontinued Microsoft MapPoint. Maptitude 2018 now supports MapPoint waypoints for routing and directions. More...
Featured Map:
Buying Power Per Household by State
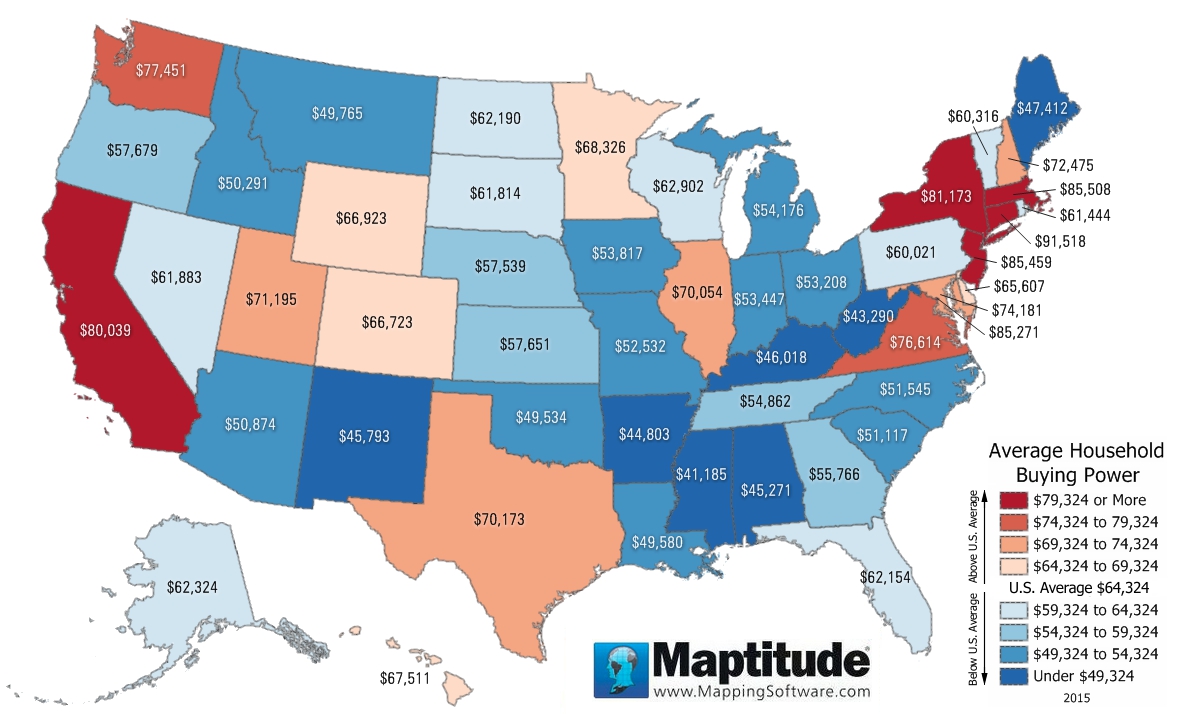
This month's featured map uses the Maptitude 2018 buying power (the amount of money available to spend) data for the United States. This data is available for ZIP Codes, Counties, States, and many other layers. Connecticut, Massachusetts, and New Jersey top the list with over $85,000 in buying power per household (total buying power per state was normalized by the number of households).
Tech Tip:
How do I update linked data?
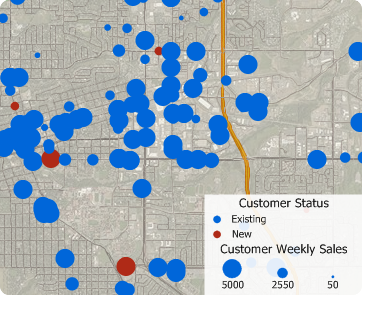
Maptitude can link your point layers with your data, and you can update your point layers with changes to your source data. You could choose this option if your data change frequently and you want a map that reflects the latest information. E.g., You have an Excel file that contains addresses and weekly sales information on your stores. You may want to link the data if you open and close stores frequently or if you want to keep the map updated with the latest weekly sales information. When you link your data, you MUST choose a column that contains unique IDs for each record in your database or spreadsheet.
Tricks & Tips:
How to open maps of the new demographics in Maptitude 2018
When you choose Map > Demographic Map Librarian, the new Maptitude 2018 maps are available for the ZIP, County, and State Map Categories.
The new Maptitude 2018 maps are listed as:
• Population - 1-Year Change
• Population - Daytime Age 18+
•
Income - 1-Year Change
Learning Maptitude:
Webinars and Training Dates for Maptitude
 |
Upcoming Training: |
|
 |
2017 Webinars (Free)! |
![]()
![]()
| News | ||
|
International Mapping:
| www.caliper.com |
Copyright ©2018, Caliper Corporation. All Rights Reserved. |