|
May 2017 Newsletter |
|||
|
|||


Website | Contact Us | Pricing | Live Demo | Free Trial | Reviews
Learning Maptitude?
New Free MapPoint Webinar; New Maptitude 2017 Videos; June & September Training Spaces Available!
 Paid Training |
 Free Webinars & Videos |
 Help System |
New "Using MapPoint Data in Maptitude" Webinar: This webinar will demonstrate using MapPoint data in Maptitude 2017. We will discuss importing a file that contains point locations and territories, editing territories and displaying patterns in the point data. We will also import a Streets & Trips file and create a route using Maptitude's routing tool. There is also a free class handout here.
"Maptitude for MapPoint Users" Webinar: This webinar will help MapPoint users new to Maptitude 2017. We will discuss mapping your data, changing the styles on a map, getting reports on custom-defined areas, creating drive-time rings, the hover label tool, and creating territories. There is also a free class handout here.
Maptitude 2017 Webinars: Upcoming webinar schedule and past webinars
Maptitude 2017 Videos & YouTube Channel: Videos for Maptitude 2017 are listed here, including a new Drawing Toolbar video. There is also a Maptitude 2017 YouTube Channel.
Maptitude 2017 Newton MA, USA Training: June, 20-22, & September, 19-21. Details | Register
![]()
![]()
What customers say about Maptitude learning materials:
 |
“I enjoy using this tool. It has a ton of features for those who need them and yet it's easy enough to navigate and produce output with more simple needs. The support is great and I highly recommend attending a training class or participating in a webinar to learn as much as possible.” Pam Kleese
Director - Marketing Information |
 |
“MAPTITUDE is easy to use yet powerful. When we have needed to ask questions the support has been fast, polite, professional and resolved our need to know how to do something. It has enhanced the service we offer our clients.” Mark Grahame
Director |
 |
“Maptitude is an excellent GIS program and is priced very low considering the value it provides. To name just a few of keys benefits I've experienced after owning it for only a week: -It has tons of geographic and demographic information -It's relatively easy for beginners -There are tons of online guides, training materials, and seminars -Tech support is very responsive and helpful I highly recommend this program to anyone looking for basic to complex functionality in a GIS program. .” Jesse Greer
Director - Inside Sales |
Featured Map:
Average 401k Assets per Participant
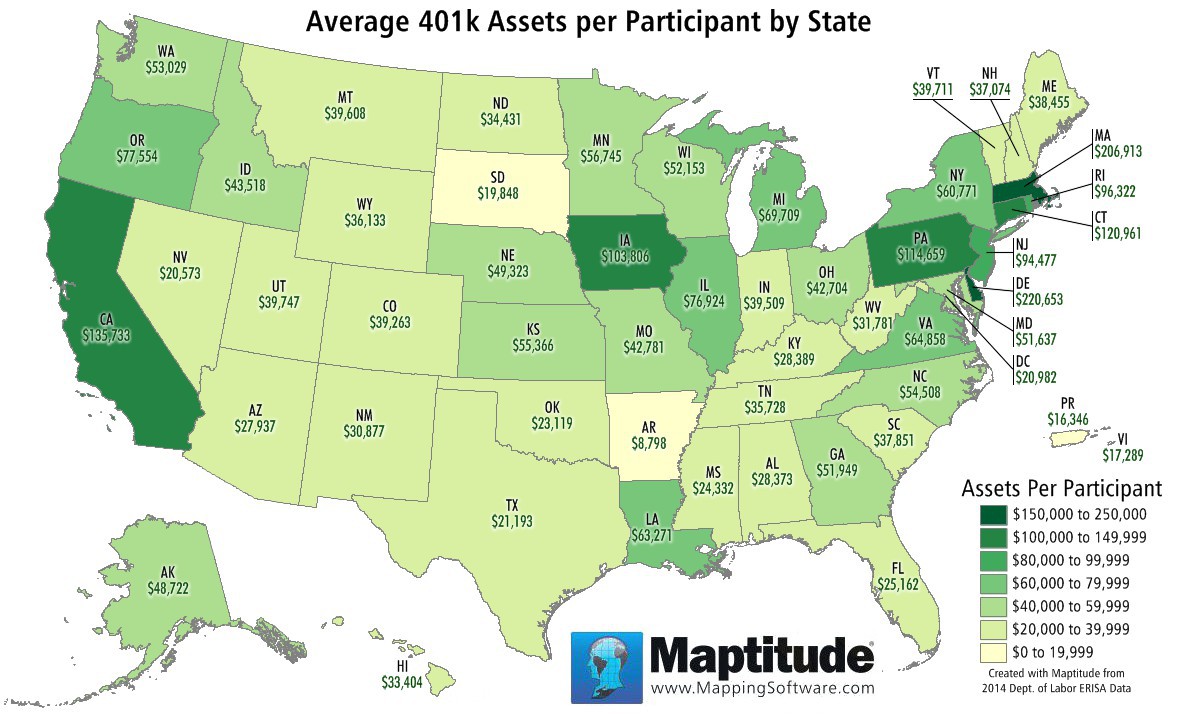
The Maptitude Team has run the numbers to map the average 401k retirement savings by state. Delaware and Massachusetts are in a league of their own with over $200,000 per retirement plan participant. California, Iowa, Pennsylvania, and Connecticut have over $100,000 in savings per saver, with every other state having under $100,000 per person. Arkansas and South Dakota have under $20,000 per plan participant. If you are interested in the data used to create this map please contact us.
Tech Tip:
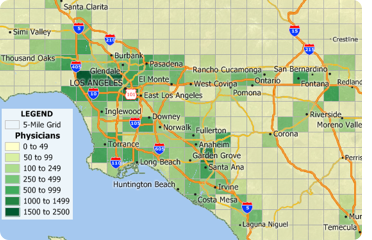
How do I create a density or heat map of my locations?
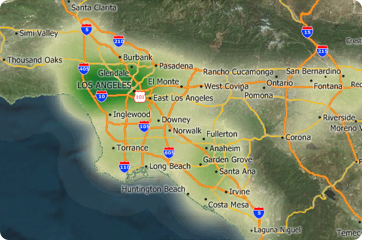
A density grid is a way to visualize and analyze point data by transforming the points into a regular grid. Each resulting grid cell is assigned a value that is determined by the density of nearby points, optionally weighting each point using a weighting value.
Density grids are useful for showing hot spots of crime, mapping the concentration of medical providers, and analyzing the pattern of clients around a store weighted by the cost of their purchases.
This Tech Tip shows how to work with the Density/Heat Layer tool in Maptitude 2017.
Tricks & Tips:
Creating Grid Layers
Grid cells enable detailed analysis and visualization of geographical patterns using identically sized boundaries for data aggregation, mathematical comparisons, and statistical analysis. These cell areas can be compared to neighbors or applied to distance analyses.
In Maptitude 2017 you can use Tools>Editing>New Grid Layer to create a grid. Grid analysis is widely used in real estate, finance/ins., and health services, with an example in this video: Expected Risk From Hurricanes.
In Maptitude 2017 we also support computing statistics for Moran's I, a measure of spatial autocorrelation particularly relevant to grid cell analysis. For more information see Help>GISDK Help or contact Support.
| www.caliper.com |
Copyright ©2017, Caliper Corporation. All Rights Reserved. |