Maptitude Geographic Information System (GIS) software is the intelligent mapping solution for business, government, and education. Maptitude is a powerful combination of software and geographic data that provides everything you need to realize the benefits of desktop mapping and spatial analysis with a single, easy-to-use package. Priced at only US$695, Maptitude is the best buy for those looking for mapping software.
In addition, Maptitude includes one FREE Country Package of your choice (a US$595 value). Choose the U.S. Country Package to get U.S. maps and detailed demographic data down to the Census Tract level.
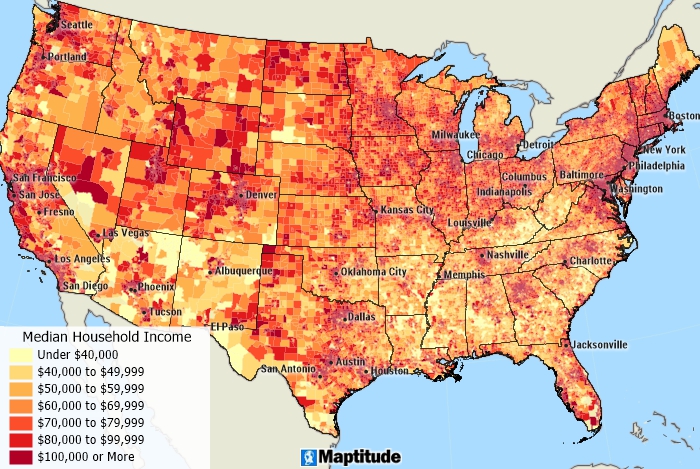
Maptitude mapping software for United States
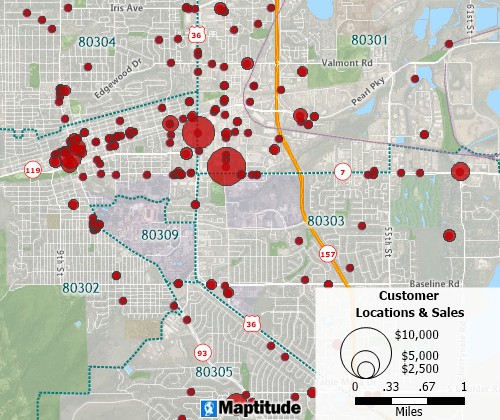
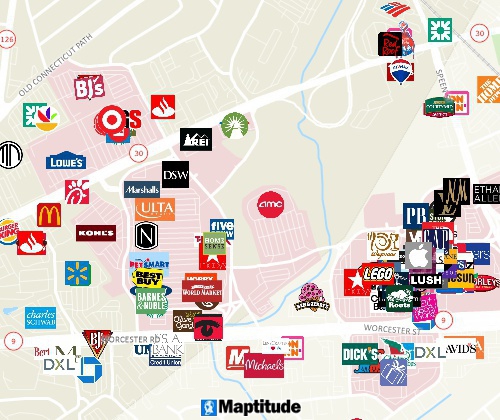
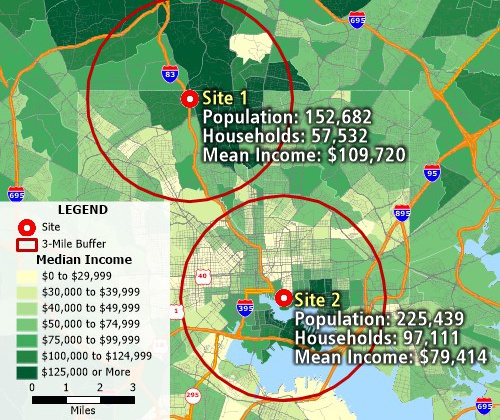
Locate your customers
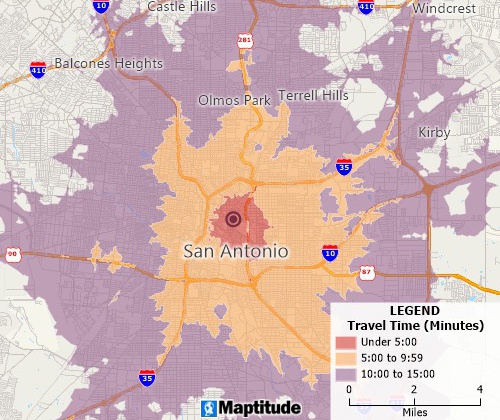
Perform drive-time analysis
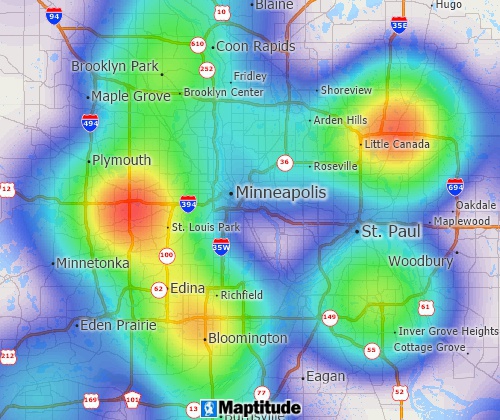
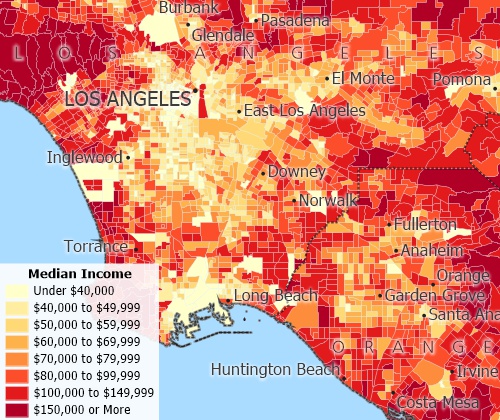
Visualize spatial patterns
The 2024 United States Country Package requires Maptitude 2024 and it is available to existing Maptitude 2024 users for US$595.
 |
“The software is very easy to use and can do a lot of analysis. It has helped me a lot with making strategic decisions for my analysis.”
|
 |
“I have taken our organization to an entirely different level with the capabilities of Maptitude. I'm able to plot sales or potential and pull data out of the map to effectively summarize and give results.”
|
The United States Country Package includes extensive geographic data so that you can get started as soon as you install the software. The following geographic files are included with the Maptitude U.S. Country Package:
| Nationwide HERE Geographic Data Layers |
|---|
HERE data are from October
2023. |
| Nationwide Census Summary Level Layers with Demographics |
|---|
|
| Other Included Nationwide United States Data Layers |
|---|
|
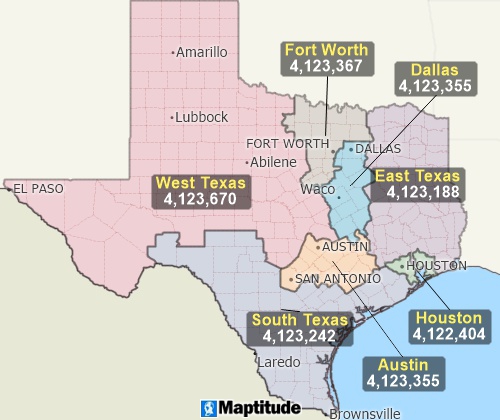
Create territories from ZIP Codes, tracts, counties, or streets
Additonal layers available for free download
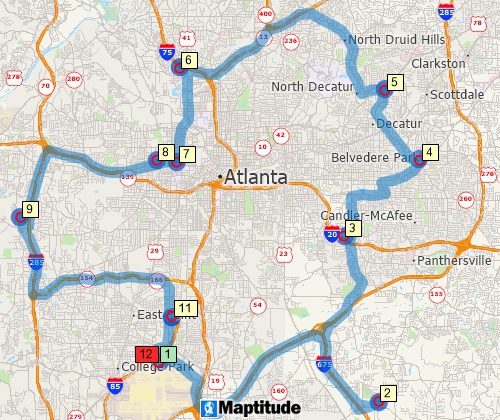
Find optimized routes serving multiple stops
The demographic data included in the U.S. Country Package allows you to make accurate and informed decisions based on diverse demographic and economic information. All of the Census boundaries that are included with Maptitude, plus 3- and 5-digit ZIP Code areas, contain several demographic profiles based on the data reported in the Census and the 2022 American Community Survey (ACS).
Census and ACS data are provided down to Census Tracts in Maptitude. There are also additional smaller boundaries called Blocks and Block Groups available separately for purchase should you need even greater detail.
Includes demographics to the Census Tract level.
Analyze locations.
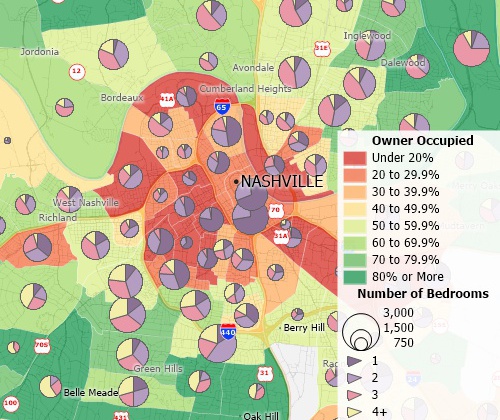
Create many types of thematic maps.
 |
“Maptitude is an excellent GIS program and is priced very low considering the value it provides. To name just a few key benefits I've experienced after owning it for only a week: It has tons of geographic and demographic information; it's relatively easy for beginners; there are tons of online guides, training materials, and seminars; tech support is very responsive and helpful. I highly recommend this program to anyone looking for basic to complex functionality in a GIS program.”
|
 |
“Maptitude is incredibly user-friendly. It can be very intimidating to use a new geospatial tool without formal training. With Maptitude, I started with no training and quickly became the in-house expert at my company. We are locating new stores, optimizing existing footprints and quantifying local market opportunities. I learn something new every time I open Maptitude and it certainly has become the go-to tool for our geospatial analytics.”
|
The following tables list the Census and ACS demographic data fields included with the ZIP Code, Census Tract, County Subdivision, MSA, County, and State layers.
HOUSEHOLD INCOME:
Median Income
% Median income change
Mean
income
% Mean income change
<$10K
$10K-14,999
$15K-24,999
$25K-34,999
$35K-49,999
$50K-74,999
$75K-99,999
$100K-149,999
$150K-199,999
$200K+
POPULATION:
Population
% Population change
Male
Female
AGE
<5
5 to 9
10 to 14
15 to 19
20 to
24
25 to 34
35 to 44
45 to 54
55 to 59
60 to 64
65 to 74
75
to 84
85+
Median age
21+
62+
<18
18+
Male 18+
Female 18+
65+
Male 65+
Female 65+
RACE & ETHNICITY
One race
White
Black
American Indian
Cherokee
Chippewa
Navajo
Sioux
Asian
Asian Indian
Chinese
Filipino
Japanese
Korean
Vietnamese
Other Asian
Hawaiian
Native Hawaiian
Guamanian/Chamorro
Samoan
Other Pacific Islander
Some other race
2+ races
White & Black
White & Am Indian
White & Asian
Black & Am Indian
Part White
Part Black
Part American Indian
Part
Asian
Part Hawaiian
Part Other
Hispanic or
Latino
Hisp. Mexican
Hisp. Puerto Rican
Hisp. Cuban
Hisp. Other
Not Hispanic or
Latino
Not Hisp. White
Not Hisp. Black
Not Hisp. Am Indian
Not Hisp. Asian
Not
Hisp. Hawaiian
Not Hisp. Other
Not
Hisp. 2+ races
Not Hisp. 2+_Incl Other
Not
Hisp. 2+_Excl Other
HOUSEHOLDS (HH)
Housing units
Households
Family households
Own children<Age 18
Married-couple
Married
children<18
Male HHer
Male
HHer children<18
Female HHer
Female HHer child<18
Nonfamily households
Living alone
Living alone 65+
Households w/1+ people <18
Households w/1+ people 65+
Average household size
Average family size
Population in households
Householder
Spouse
Child
Other relatives
Nonrelatives
MARITAL STATUS
Males Age 15+
Never married
Now married
Separated
Widowed
Divorced
Females Age
15+
Never married
Now married
Separated
Widowed
Divorced
BIRTHS
Women w/birth in past 12 mo
Unmarried
Unmarried_Per 1000
Per 1000 women 15-50
Per 1000 women 15-19
Per 1000 women 20-34
Per 1000 women 35-50
GRANDPARENTS
Living w/own grchild<18
Responsible for own grchild<18
Grchild age<1
Grchild age 1-2
Grchild age 3-4
Grchild age 5+
Female
Married
EDUCATION
In school 3+
Nursery/preschool
Kindergarten
Elementary
High school
College/grad school
Population 25+
25+ <9th grade
25+
some HS, no diploma
25+ High school grad
25+ Some
college, no degree
25+ Associate degree
25+ Bachelor's degree
25+ Grad or prof degree
25+ % HS grad or higher
25+ % bachelor's or
higher
DISABILITY POPULATION
Civilian 18+
Civilian 18+_Veterans
Civilian noninst
population
W/disability
Age <18
<18_W/disability
Age 18-64
18-64_W/disability
Age
65+
65+_W/disability
PREVIOUS YEAR RESIDENCE
Population age 1+
Same house
Different
house
Same county
Diff county
Diff county_Same
state
Diff county_Diff state
Moved from abroad
LANGUAGE
Population 5+
5+ English only
5+ Other language
Speak English<very well
Spanish
Spanish & Eng<very well
Other Indo-European
Indo-Eur & Eng<very well
Asian and Pacific Is
API
& Eng<very
well
Other
Other & Eng<very well
NATIVITY
Native
Born in US
Born in US_Res state
Born in US_Diff state
Born outside US
Foreign
born
Naturalized citizen
Not a citizen
Population born outside US
Native
Native Ent 2010+
Native Ent <2010
Foreign born
Foreign Ent 2010+
Foreign Ent <2010
Foreign born
Born in Europe
Born in Asia
Born
in Africa
Born in Oceania
Born in Latin America
Born in North America
ANCESTRY
US or American
Arab
Czech
Danish
Dutch
English
French (ex Basque)
French Canadian
German
Greek
Hungarian
Irish
Italian
Lithuanian
Norwegian
Polish
Portuguese
Russian
Scotch-Irish
Scottish
Slovak
Subsaharan African
Swedish
Swiss
Ukrainian
Welsh
West Indian (ex Hisp)
LABOR FORCE
(LF)
Population 16+
16+ In labor force
In
LF_Civilian
In LF_Civilian Employed
In
LF_Civilian Unemployed
In LF_Armed Forces
Not in labor force
In LF_Civilian_Unempl_%
Females 16+
In labor force
In
LF_Civilian
In LF_Civilian_Employed
Own children<6
All parents in LF
Own children age 6-17
All parents in LF
VEHICLES
Vehicles_None
Vehicles_1
Vehicles_2
Vehicles_3+
COMMUTE
Workers 16+
Mode: Car_Drove alone
Mode:
Car_Carpooled
Mode: Public trans
Mode:
Walked
Mode: Other means
Mode: Worked at
home
16+ Mean travel time to work
Travel time <5
min
Travel time 5-9 min
Travel time 10-14 min
Travel time 15-19 min
Travel time 20-24 min
Travel
time 25-29 min
Travel time 30-34 min
Travel time
35-39 min
Travel time 40-44 min
Travel time 45-59
min
Travel time 60-89 min
Travel time 90+ min
EMPLOYMENT
Employed civilian pop age 16+
Occ:
Manage/prof
Occ: Service
Occ:
Sales/office
Occ: Nat res/constr/maint
Occ: Prod/transp/material
Ind:
Ag/forestry/fish/mine
Ind: Construction
Ind: Manufacturing
Ind: Wholesale trade
Ind: Retail trade
Ind:
Transportation/warehouse
Ind: Information
Ind: Finance/ins/RE/rental
Ind:
Prof/scientific/admin
Ind: Ed/health/soc
services
Ind: Art/ent/rec/acc/food
Ind: Other (ex public admin)
Ind: Public
administration
Private wage/salary
Government
Self-employed
Unpaid family
EARNINGS & FAMILY INCOME
Households w/earnings
Mean earnings
HH w/Social Security income
w/SS_Mean income
HH w/retirement Income
w/retirement_Mean income
HH w/SSI Income
w/SSI_Mean
income
HH w/public assistance income
w/PA_Mean
income
HH_W/SNAP benefits
Families
Fam_Inc: <$10K
Fam_Inc: $10K-$14,999
Fam_Inc:
$15K-$24,999
Fam_Inc: $25K-$34,999
Fam_Inc:
$35K-$49,999
Fam_Inc: $50K-$74,999
Fam_Inc:
$75K-$99,999
Fam_Inc: $100K-$149,999
Fam_Inc:
$150K-$199,999
Fam_Inc: $200K+
Median family
income
Mean family income
Per capita income
Median nonfamily income
Mean nonfamily income
Median earnings for workers
Median earnings Male
full-time
Median earnings Female full-time
HEALTH INSURANCE
Civilian Noninst_W/health ins
Private
Public
No health ins
Civilian Noninst
Pop <19
No health ins
Civilian Noninst Pop 19-64
19-64_In labor force
19-64_In LF_Employed
W/health ins
W/health ins_Private
W/health ins_Public
No health ins
19-64_In LF_Unemployed
W/health ins
W/health ins_Private
W/health
ins_Public
No health ins
19-64_Not in labor force
W/health ins
W/health
ins_Private
W/health ins_Public
No health ins
POVERTY
Pct in
poverty All families
All fam_Child<18
All fam_All child<5
Pct in
poverty Married couple
Married_Child<18
Married_All
child<5
Pct in poverty w/female HHer
Fem HHer_Child<18
Fem HHer_All
child<5
Pct in poverty_All people
<18
Child<18
Child<5
Child 5-17
Age 18+
Age 18-64
Age 65+
People in families
In fam_Unrelated 15+
INCOME BY RACE & ETHNICITY
Median HH Inc. White
Median HH Inc. Black
Median HH Inc. Am Indian
Median HH Inc. Asian
Median HH Inc. Hawaiian
Median HH Inc. Other
Median HH Inc. 2+ Races
Median HH Inc. Not Hisp. White
Median HH Inc. Hispanic
Aggregate income
Aggregate Inc. White
Aggregate Inc. Black
Aggregate Inc. Am Indian
Aggregate Inc. Asian
Aggregate Inc. Hawaiian
Aggregate Inc. Other
Aggregate Inc. 2+
Races
Aggregate Inc. Not Hisp. White
Aggregate Inc. Hispanic
HOUSING UNITS
Occupied
Vacant
Homeowner vacancy rate
Rental vacancy rate
Housing
units 1 detached
Housing units 1 attached
Housing
units 2
Housing units 3-4
Housing units 5-9
Housing units 10-19
Housing units 20+
Housing
units Mobile home
Housing units Boat/RV/van
Built
2010+
Built 2000 to 2009
Built 1990 to 1999
Built 1980 to 1989
Built 1970 to 1979
Built 1960
to 1969
Built 1950 to 1959
Built 1940 to 1949
Built 1939 or earlier
HOUSING UNIT OCCUPANCY
Occupants/room_1 or
less
Occupants/room_1.01-1.5
Occupants/room_1.5+
HOUSING UNIT VALUE
<$50K
$50K-99,999
$100K-149,999
$150K-199,999
$200K-299,999
$300K-499,999
$500K-999,999
$1,000,000+
Median value
HOUSING UNIT TENURE
Owner-occupied
Renter-occupied
Owner-occupied_Avg HH size
Renter-occupied_Avg HH size
Moved in 2019+
Moved in 2015 to 2018
Moved in 2010 to 2014
Moved
in 2000 to 2009
Moved in 1990 to 1999
Moved in
1989 or earlier
HOUSING UNIT ROOMS
1 Room
2 Rooms
3 Rooms
4 Rooms
5 Rooms
6
Rooms
7 Rooms
8 Rooms
9+ Rooms
Median rooms
No Bedrooms
1 Bedroom
2 Bedrooms
3 Bedrooms
4
Bedrooms
5+ Bedrooms
HOUSING UNIT
UTILITIES
Heat_Utility gas
Heat_Bottled/tank/LP gas
Heat_Electricity
Heat_Fuel oil/kerosene
Heat_Coal/coke
Heat_Wood
Heat_Solar energy
Heat_Other fuel
Heat_No fuel
used
Lacking complete plumbing
Lacking complete
kitchen
No telephone service
INCOME BY HOUSEHOLDER AGE
HHer <25
Income <$10K
Income
$10K-14,999
Income $15K-19,999
Income $20K-24,999
Income $25K-29,999
Income $30K-34,999
Income
$35K-39,999
Income $40K-44,999
Income $45K-49,999
Income $50K-59,999
Income $60K-74,999
Income
$75K-99,999
Income $100K-124,999
Income $125K-149,999
Income
$150K-199,999
Income $200K+
HHer 25-44
Income <$10K
Income
$10K-14,999
Income $15K-19,999
Income $20K-24,999
Income $25K-29,999
Income $30K-34,999
Income
$35K-39,999
Income $40K-44,999
Income $45K-49,999
Income $50K-59,999
Income $60K-74,999
Income
$75K-99,999
Income $100K-124,999
Income $125K-149,999
Income
$150K-199,999
Income $200K+
HHer 45-64
Income <$10K
Income
$10K-14,999
Income $15K-19,999
Income $20K-24,999
Income $25K-29,999
Income $30K-34,999
Income
$35K-39,999
Income $40K-44,999
Income $45K-49,999
Income $50K-59,999
Income $60K-74,999
Income
$75K-99,999
Income $100K-124,999
Income $125K-149,999
Income
$150K-199,999
Income $200K+
HHer 65+
Income <$10K
Income
$10K-14,999
Income $15K-19,999
Income $20K-24,999
Income $25K-29,999
Income $30K-34,999
Income
$35K-39,999
Income $40K-44,999
Income $45K-49,999
Income $50K-59,999
Income $60K-74,999
Income
$75K-99,999
Income $100K-124,999
Income $125K-149,999
Income
$150K-199,999
Income $200K+
HHer <25_Median income
HHer
25-44_Median income
HHer 45-64_Median income
HHer
65+_Median income
VOTING AGE POPULATION
Citizen Voting Age Pop
18-29
30-44
45-64
65+
<9th Grade
HS Grad
Some College
Associate's Deg
Bachelor's Deg
Grad/Prof Deg
Citizen VAP with Poverty Status
Citizen VAP below
Poverty Level
Citizen VAP above Poverty Level
Census defines a household to be those people living in the same occupied housing unit. That definition needs to be modified when modeling activities by households to separately capture the behavior of unrelated people living in a household, and also extended to include residents of colleges and military bases. The following data fields were estimated by Caliper from the 2022 5-Year American Community Survey (ACS) and the 2020 Census:
Unique Households
UniqHH_1 Person
UniqHH_2
Person
UniqHH_3 Person
UniqHH_4 Person
UniqHH_5 Person
UniqHH_6 Person
UniqHH_7+ Person
Caliper estimates the daytime adult populations using data from the 2020 Census as well as the Longitudinal Employer-Household Dynamics dataset from Census:
Daytime Age 18+
POPULATION
Population
VOTING
AGE
18+_Pop
RACE
White
Black
AmIndian
Asian
Hawaiian
Other
2+ RACES
2+ Races
WhtBlk
WhtAmI
WhtAsn
BlkAmI
Any Part Wht
Any Part Blk
Any Part AmI
Any Part Asn
Any Part Hwn
Any Part Oth
ETHNICITY
Hispanic Origin
Not Hispanic
Not Hisp. Wht
Not Hisp. Blk
Not Hisp. AmI
Not Hisp. Asn
Not Hisp. Hwn
Not Hisp. Oth
Not Hisp. 2+ Races
Not Hisp. WhtBlk
Not Hisp. WhtAmI
Not Hisp. WhtAsn
Not Hisp. BlkAmI
HOUSING
Housing UnitsOccupied Units
Vacant Units
People in group quarters
InGrp_Institutionalized
InGrp_Correctional
InGrp_Juvenile
InGrp_Nursing
InGrp_Other Inst
InGrp_Noninstitutionalized
InGrp_College
InGrp_Military
InGrp_Other Non
POPULATION
2010 Population
AGE
Age 18+
Age 21+
Age 62+
Age 65+
Median age
Male median age
Female
median age
Age <5
Age
5 to 9
Age 10 to 14
Age 15 to 17
Age 18 and 19
Age 20
Age 21
Age 22 to 24
Age 25 to 29
Age 30 to
34
Age 35 to 39
Age 40 to 44
Age
45 to 49
Age 50 to 54
Age 55 to 59
Age 60 and 61
Age 62 to 64
Age 65
and 66
Age 67 to 69
Age 70 to 74
Age 75 to 79
Age 80 to 84
Age 85+
HOUSEHOLDS
Households
Average HH Size
People in households
HOUSEHOLD TYPES
People in family HH
Householder
HHer_Male
HHer_Female
Spouse
Child
Other relatives
Nonrelatives
People in nonfamily HH
Male
HHer
Female HHer
Nonrelatives
People in group quarters
Institutionalized
Noninstitutionalized
RACE
1 Race
White
Black
American Indian
Asian
Other Asian
Hawaiian
Other Race
2+ Races
Part White
Part Black
Part AmIndian
Part Asian
Part Hawaiian
Part Other
ETHNICITY
Hispanic
Origin
Not Hispanic or Latino
Not
Hispanic White
FAMILIES
HH_Family
Husband-wife
Other
Other_Male HHer
Other_Female HHer
HH_Nonfamily
Living alone
Not
living alone
HH w/people <18
HH w/people
65+
Average Family Size
FEMALE POPULATION
Female
Female <5
Female 5 to
9
Female 10 to 14
Female 15 to 17
Female 18 and 19
Female 20
Female
21
Female 22 to 24
Female 25 to 29
Female 30 to 34
Female 35 to 39
Female 40 to 44
Female 45 to 49
Female 50 to 54
Female 55 to 59
Female 60 and 61
Female 62 to 64
Female 65 and 66
Female 67 to 69
Female 70 to 74
Female 75 to 79
Female 80 to 84
Female 85+
Female 18+
Female 65+
MALE POPULATION
Male
Male <5
Male 5 to 9
Male 10 to 14
Male 15 to 17
Male 18
and 19
Male 20
Male 21
Male 22
to 24
Male 25 to 29
Male 30 to 34
Male 35 to 39
Male 40 to 44
Male 45
to 49
Male 50 to 54
Male 55 to 59
Male 60 and 61
Male 62 to 64
Male
65 and 66
Male 67 to 69
Male 70 to 74
Male 75 to 79
Male 80 to 84
Male
85+
Male 18+
Male 65+
HOUSING UNITS
Housing Units
Occupied
Vacant
Vacant_Seasonal
Owner occupied
Renter occupied
Owner occ: Avg HH size
Renter occ: Avg HH size
In addition to the demographic data above, the FFIEC Census Tract layer contains over 1000 fields of Federal Financial Institutions Examination Council (FFIEC) 2022 ACS data (PDF). These data help financial institutions protect consumers and communities but also provide valuable data for use in all industries.
The Census Tract, County, State, and ZIP Code layers contain five fields with disposable income data:
Total Buying Power
Filing Status: Single_Buying Power
Filing Status: Married_Buying Power
Filing Status: Head of
HH_Buying Power
The County and State layers contain two fields with personal income data:
2022 Personal Income
Percent Change in Personal Income 2021-22
The ZIP Code layer contains three fields with healthcare data:
Number of hospitals
Number of hospital beds
Number of healthcare providers
The County layer contains the following fields with 2022 real gross domestic product data:
GDP
Percent GDP Change
GDP Goods
GDP Services
GDP Government
Agriculture/Forestry/Fishing/Hunting GDP
Mining/Quarrying/Oil&Gas GDP
Utilities GDP
Construction GDP
Durable Goods Manufacturing GDP
Nondurable Goods Manufacturing GDP
Wholesale Trade GDP
Retail Trade GDP
Transportation/Warehousing GDP
Information GDP
Finance & Insurance GDP
Real Estate/Rental&Leasing GDP
Prof/Sci/Tech Services GDP
Management GDP
Admin/SupportWaste Mgmt GDP
Educational Services GDP
Health Care/Social Assistance GDP
Arts/Entertainment/Recreation GDP
Accommodation/Food Services GDP
Other Private Services GDP
In addition to the demographic and disposable income data above, the 3-digit and 5-digit ZIP Code area layers provided with Maptitude include 2021 ZIP Code Business Patterns (ZBP) data. The following table lists the business data fields included with the ZIP Code layers:
EMPLOYEES:
Total Mid-March Employees
PAYROLL:
Total 1st Qtr Payroll
Total Annual Payroll
ESTABLISHMENTS:
Total Establishments
Ag/Forestry/Fishing/Hunting
Mining/Quarrying/Oil & Gas
Utilities
Construction
Manufacturing
Wholesale Trade
Retail Trade
Transportation/Warehousing
Information
Finance/Insurance
ESTABLISHMENTS (Continued):
Real Estate
Prof./Science/Tech Services
Management
Admin/Support and Waste Mgmt
Educational Services
Health Care/Social Assistance
Arts/Entertainment/Recreation
Accommodation/Food Services
Other Services
Unclassified Establishments
The following tables list the population projections data fields included with the Census Tract, County, and State layers:
2025_Population
2025_Age <5
2025_Age 5 to 9
2025_Age 10 to 14
2025_Age 15 to 19
2025_Age 20 to 24
2025_Age 25 to 29
2025_Age 30 to 34
2025_Age 35 to 39
2025_Age 40 to 44
2025_Age 45 to 49
2025_Age 50 to 54
2025_Age 55 to 59
2025_Age 60 to 64
2025_Age 65 to 69
2025_Age 70 to 74
2025_Age 75 to 79
2025_Age 80 to 84
2025_Age 85+
2025_Male
2025_Female
2025_White
2025_Black
2025_Hispanic Origin
2025_Other
Race
2030_Population
2035_Population
2040_Population
2045_Population
2050_Population
2055_Population
2060_Population
2065_Population
2070_Population
2075_Population
2080_Population
2085_Population
2090_Population
2095_Population
2100_Population
Click HERE for more information on Maptitude, or request a live demo now.