Maptitude is the most competitively priced professional map creation software available. Maptitude is unique in the marketplace for providing comprehensive data and functionality for a single low price of $795.
Maptitude brings data to life with maps that impress and inform. Every business needs maps, whether to choose the route salespeople take when they call on clients or to create maps of service areas for franchisees. And that’s why Maptitude makes good sense for businesses. It’s packed with demographic data, works well with Microsoft applications, and is easy enough for the geographically challenged to use.
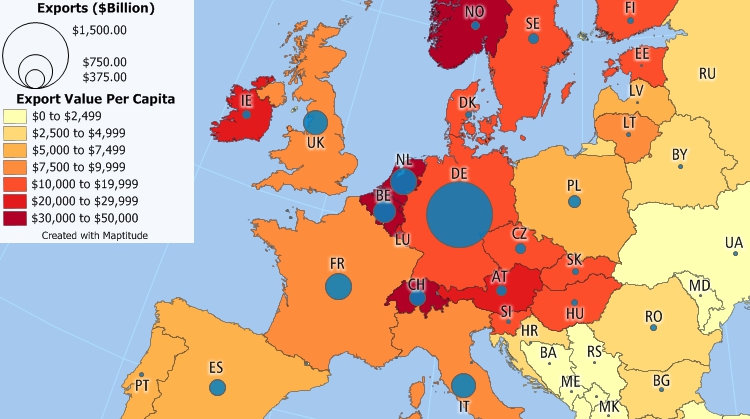
Create maps at any scale and convey information with heat maps, bubble maps, dot-density maps, chart maps, and 3-D maps.
After installing Maptitude you can create a quality map of your data in just a few simple steps. You can use any of your own geographic, tabular, or GPS data. Given a spreadsheet or database file that is full of name, address, and sales information, Create-a-Map Wizard gives start-to-finish assistance for locating, analyzing, and mapping data. In a few easy steps, you can create maps with your customer locations, heat/color code Postal/ZIP Codes with your sales information, build rings around your stores, and much more.
The Display Manager allows a map to be completely customized on-the-fly. You can easily modify styles, text, pushpin icons, and all other map content. The maps can be displayed in a wide variety of ways and formatted to meet your specific requirements.
Maptitude excels at allowing you to create territories or service areas. You can interactively choose from any boundary layer such as postal codes or Counties, you can import a table of pre-defined territories, and you can even interactively draw and modify your own regions. When building your areas you can see a running total of your target audience assigned to each zone, such as specific age groups or income brackets.
Drive-time zones are another powerful tool. They display the approximate distance you can travel within a specified time frame from a central point, say your business locale, which is very useful for analyzing a customer base. Because they take individual streets into account in the calculations, the drive- time rings produced in Maptitude are the most geographically accurate of those in any mapping software. Other features include estimating the population surrounding a location, 3D visualizations, hot-spotting, site location models, and travel route planning.
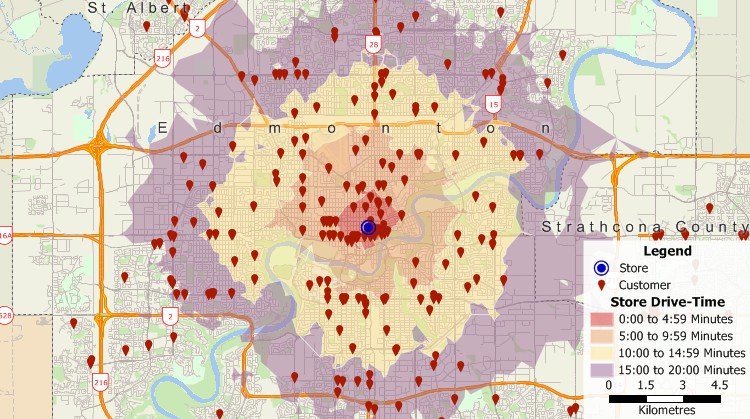
Maptitude map creation software can help you determine the accessibility of your facilities to your customers
Once you have created your maps, you can copy and paste them to other documents, you can print to any printer or plotter, including PDF, or save them to a variety of formats including JPEG, EMF, HTML, and Google Earth KML and KMZ.
Read more about Maptitude map creation software (PDF).
Home | Products | Contact | Secure Store

 Check out our G2 Reviews