Unbeatable value for sales territory management, data mapping,
demographics, radius maps, unlimited geocoding, report creation,
routing, heat/thematic maps, market analysis, site selection, and
more
Maptitude 2025 delivers the latest and most
accurate data along with significant improvements in sales territory
management, online mapping, vehicle routing, database performance,
and ease of use. The new version includes:
- October 2024 HERE® map content for up‑to‑date streets,
addresses, drive‑times, and postal layers
- 2023 ACS demographics
plus population projections and other refreshed datasets
- Expanded territory tools, including auto‑assigning holes and
detecting non‑touching areas for balanced coverage
- More powerful
routing with cost factors (e.g., per hour/per mile),
side‑specific pickups, minimized idle time, and Excel route
summaries
- No upper limits on drivetime rings or multi‑origin
influence areas
- Support for trillions‑record databases and
multi‑field “Group By” summaries
- Improved link‑your‑data steps
in the wizards that now also support updating territories from
external tables
- Enhanced Maptitude Online with drag‑and‑drop
uploads, dynamic chart themes (e.g., clustering), drive‑time
rings, and brand‑new online territory management
- AI‑powered
Virtual Assistant and updated help and GISDK documentation for
rapid learning and development

|
“Powerful, Versatile Mapping Tool.
It's easy to use. Very versatile for different types of use cases. I have been using Maptitude for the last 7 years for healthcare consulting projects. We have purchased many licenses for our team. Caliper customer service is fantastic. I receive quick responses and clear answers to my questions.”
Leah Strub
Product Manager, Intellimed International
|
 |
“The support team is fantastic and always quick to respond. Thank you! Also
the new features in the Maptitude program make my job easier! Thanks!! Favorite aspect of this product? Ease of use as well as being able to find out specific info within my drive rings. This is a great product that I have had to learn to use, with no training which has been fairly easy.”
Lana Mischke-Kiernan
Administrative Manager, Emergency Management Group Inc.
|
Powerful Data Analysis and Visualization
Maptitude 2025 continues to build on its
reputation for user‑friendly, robust mapping. With updated
business‑critical data (including the 2023 ACS and
2025 ZIP Code layers), you can:
- Analyze demographic changes using fresh population, income,
GDP, and buying‑power statistics
- Access new demographics such as types of health insurance by
age bracket, and new data layers such as Census Block Groups
- Access data for Australia, Brazil, Canada, Mexico, New
Zealand, Europe, and the UK, and many other regions
- Seamlessly geocode addresses in the US, Europe, and beyond
with the latest postal and street updates

The U.S. Country Package includes 2023
American Community Survey data down to the Census Block Group level
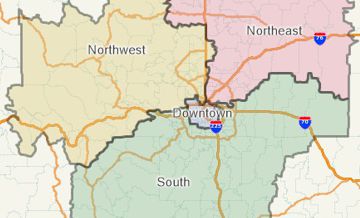
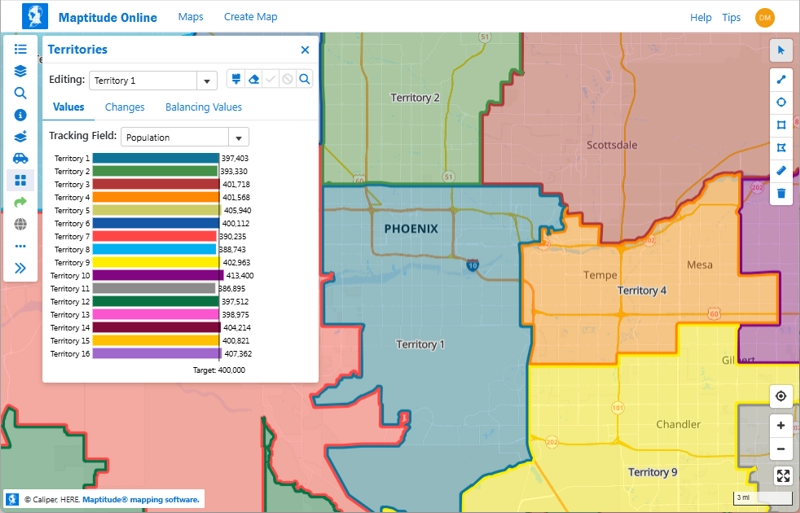
Smarter Territory Management
Maptitude has always been a leading choice for sales territory
managers, and Maptitude 2025 continues in providing
tools critical to your data-to-day management of critical business
data:
- Automatically assign or fill unassigned holes within territories

- Detect non‑touching areas so you can
identify possible errors and better optimize your territory
boundaries
- Sync external data changes with territory definitions to
keep assignments up to date
- Generate a “Territory Workload Report” to see whether each
territory has too much or too little activity

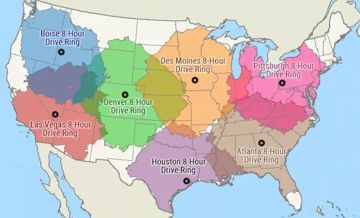
More Powerful Routing & Logistics
Maptitude 2025 provides comprehensive routing,
directions, and vehicle management capabilities:
- Plan routes factoring in per‑mile/per‑hour costs for fuel,
labor, or refrigerated (“reefer”) operations
- Minimize vehicle
idle time to lower labor costs and improve fleet utilization
- Route vehicles on left or right side only when pickups and
deliveries have side constraints
- Produce Excel route summaries
and details, complete with stops, timestamps, distances, and
costs
- Utilize unlimited drive‑time rings and multi‑origin
influence areas for coverage analysis

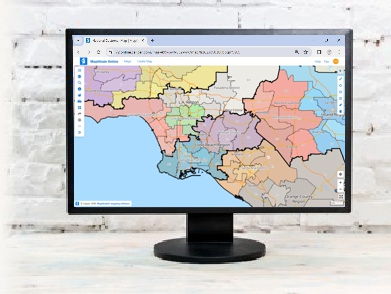
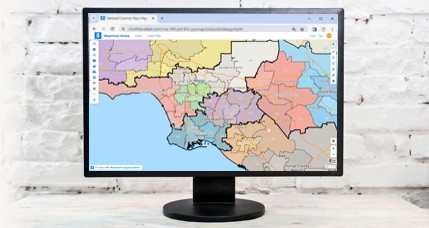
Enhanced Online Analysis, Sharing, and Publishing
Maptitude Online is both a
map‑sharing add‑in for desktop and a stand‑alone
browser application that doesn't require a desktop
install. New in 2025:
- Drag‑and‑drop file uploads (up to 4 MB
and 25,000 rows), plus
improved handling of large data
- New territory tools for creating or
editing territories from ZIP Codes, States, Counties, or
Census Tracts
- Enhanced Create‑a‑Map Wizard with
dynamic chart themes (clustering, color‑size combos) and
drive‑time rings

- Streamlined user interface: side menus for quick
editing, multi‑field labels, improved mobile
responsiveness
Updated Documentation and Support
Getting started with Maptitude 2025 is easier
than ever:
- AI‑powered Maptitude Support Chat helps
with questions 24/7
- Refreshed online Learning Portal with new
tutorials, videos, and demos
- Updated Maptitude Help and GISDK
documentation for developers
Using the latest version of Maptitude ensures you have
the most accurate data and cutting‑edge GIS functionality available.
What's New in 2025 (PDF)
Upgrade or Purchase Now